29
/
en
AIzaSyAYiBZKx7MnpbEhh9jyipgxe19OcubqV5w
April 1, 2024
44280
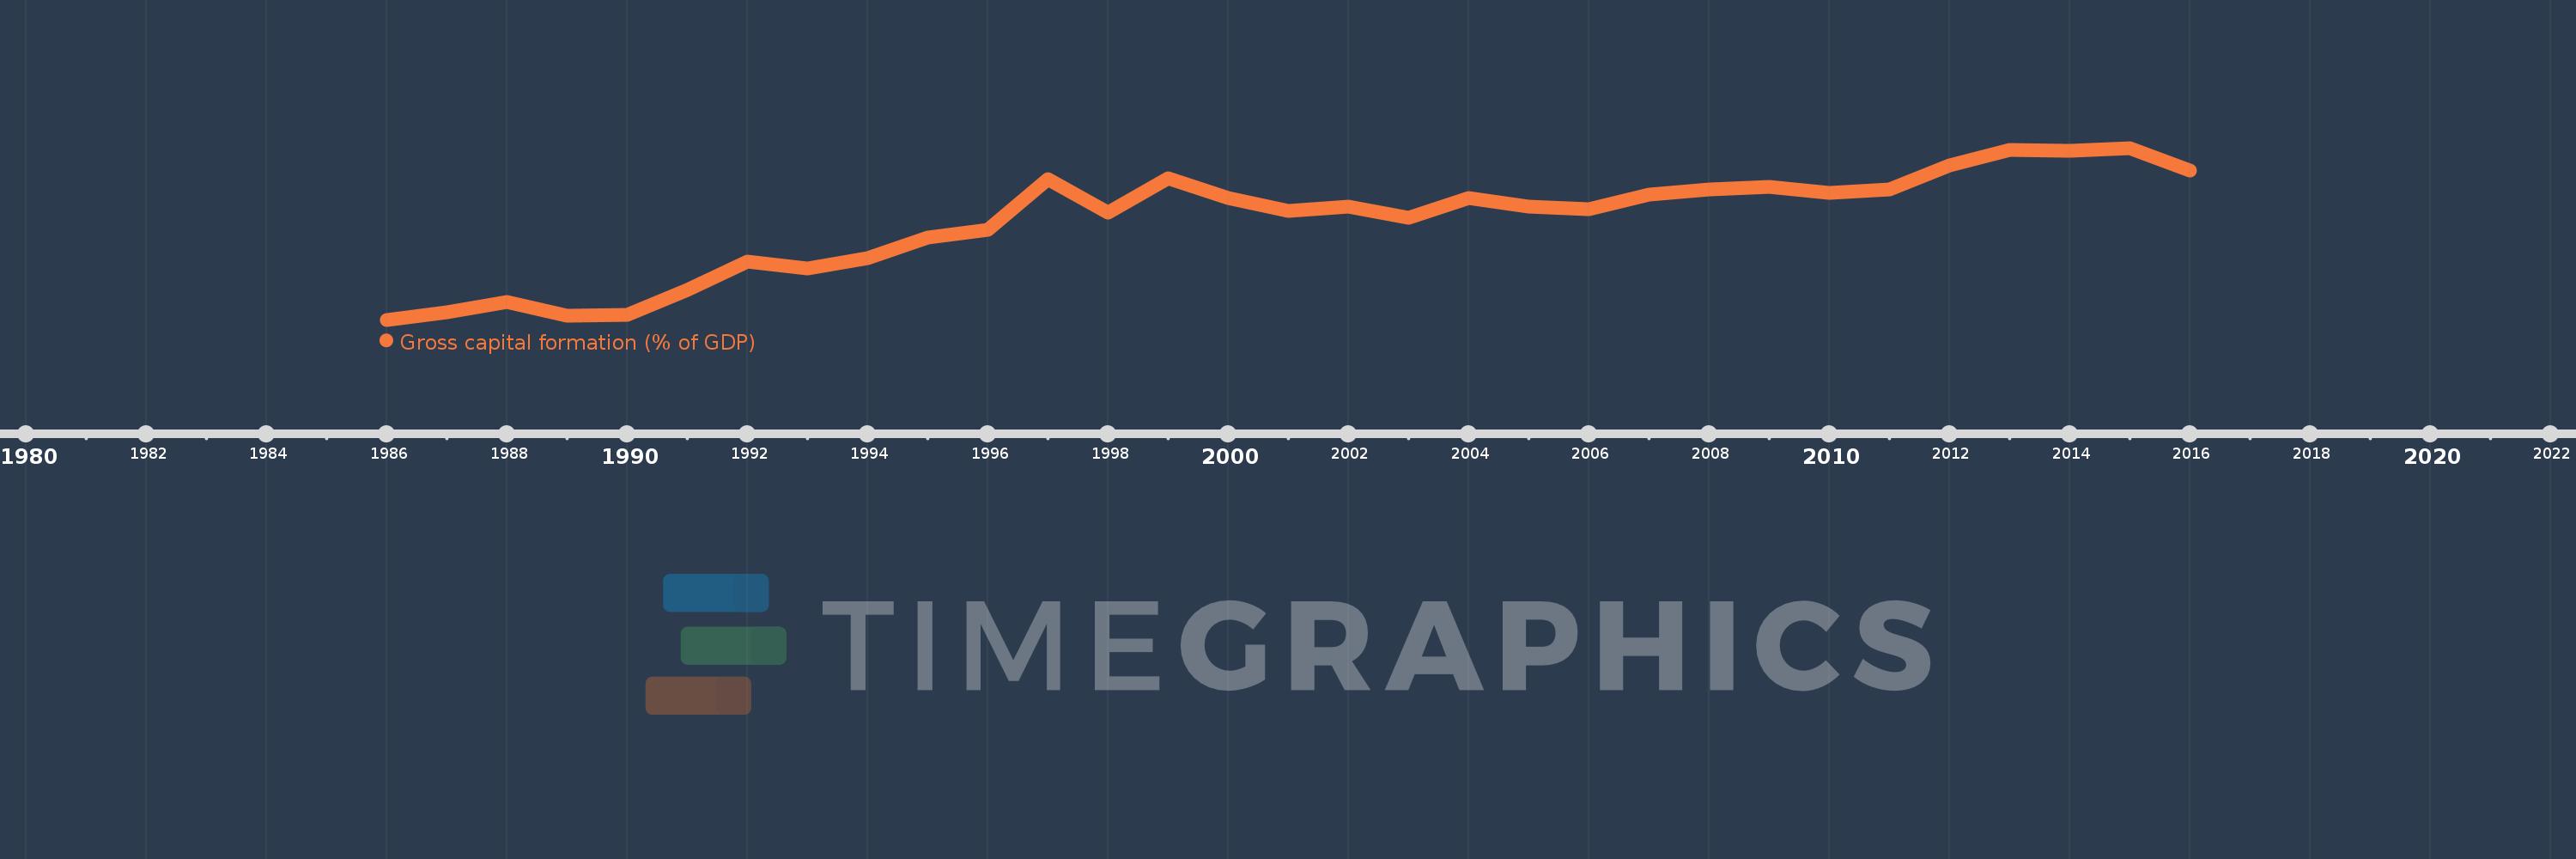
Least developed countries: UN classification
LDC
false
2
1
Gross capital formation (% of GDP)
2016,2015,2014,2013,2012,2011,2010,2009,2008,2007,2006,2005,2004,2003,2002,2001,2000,1999,1998,1997,1996,1995,1994,1993,1992,1991,1990,1989,1988,1987,1986
This statistics in other country:
AfghanistanAlbaniaAlgeriaAngolaAntigua and BarbudaArab WorldArgentinaArmeniaArubaAustraliaAustriaAzerbaijanBahamas, TheBahrainBangladeshBarbadosBelarusBelgiumBelizeBeninBermudaBhutanBoliviaBosnia and HerzegovinaBotswanaBrazilBrunei DarussalamBulgariaBurkina FasoBurundiCabo VerdeCambodiaCameroonCanadaCaribbean small statesCentral African RepublicCentral Europe and the BalticsChadChileChinaColombiaComorosCongo, Dem. Rep.Congo, Rep.Costa RicaCote d'IvoireCroatiaCubaCyprusCzech RepublicDenmarkDjiboutiDominicaDominican RepublicEarly-demographic dividendEast Asia & PacificEast Asia & Pacific (excluding high income)East Asia & Pacific (IDA & IBRD countries)EcuadorEgypt, Arab Rep.El SalvadorEquatorial GuineaEritreaEstoniaEthiopiaEuro areaEurope & Central AsiaEurope & Central Asia (excluding high income)Europe & Central Asia (IDA & IBRD countries)European UnionFaroe IslandsFijiFinlandFragile and conflict affected situationsFranceGabonGambia, TheGeorgiaGermanyGhanaGreeceGrenadaGuatemalaGuineaGuinea-BissauGuyanaHaitiHeavily indebted poor countries (HIPC)High incomeHondurasHong Kong SAR, ChinaHungaryIBRD onlyIcelandIDA & IBRD totalIDA blendIDA onlyIDA totalIndiaIndonesiaIran, Islamic Rep.IraqIrelandIsraelItalyJamaicaJapanJordanKazakhstanKenyaKiribatiKorea, Rep.KosovoKuwaitKyrgyz RepublicLao PDRLate-demographic dividendLatin America & Caribbean Latin America & Caribbean (excluding high income)Latin America & the Caribbean (IDA & IBRD countries)LatviaLeast developed countries: UN classificationLebanonLesothoLiberiaLibyaLithuaniaLow & middle incomeLow incomeLower middle incomeLuxembourgMacao SAR, ChinaMacedonia, FYRMadagascarMalawiMalaysiaMaldivesMaliMaltaMauritaniaMauritiusMexicoMicronesia, Fed. Sts.Middle East & North AfricaMiddle East & North Africa (excluding high income)Middle East & North Africa (IDA & IBRD countries)Middle incomeMoldovaMongoliaMontenegroMoroccoMozambiqueNamibiaNepalNetherlandsNew CaledoniaNew ZealandNicaraguaNigerNigeriaNorth AmericaNorwayOECD membersOmanOther small statesPacific island small statesPakistanPanamaPapua New GuineaParaguayPeruPhilippinesPolandPortugalPost-demographic dividendPre-demographic dividendPuerto RicoQatarRomaniaRussian FederationRwandaSaudi ArabiaSenegalSerbiaSeychellesSierra LeoneSingaporeSlovak RepublicSloveniaSmall statesSolomon IslandsSomaliaSouth AfricaSouth AsiaSouth Asia (IDA & IBRD)South SudanSpainSri LankaSt. Kitts and NevisSt. LuciaSt. Vincent and the GrenadinesSub-Saharan Africa Sub-Saharan Africa (excluding high income)Sub-Saharan Africa (IDA & IBRD countries)SudanSurinameSwazilandSwedenSwitzerlandSyrian Arab RepublicTajikistanTanzaniaThailandTimor-LesteTogoTongaTrinidad and TobagoTunisiaTurkeyTurkmenistanUgandaUkraineUnited Arab EmiratesUnited KingdomUnited StatesUpper middle incomeUruguayUzbekistanVanuatuVenezuela, RBVietnamWest Bank and GazaWorldYemen, Rep.ZambiaZimbabwe Timeline:
This timeline shows a graph from 1986 to 2016 of Least developed countries: UN classification. No data until 1985. Number of actual observations by date: 31.
Source name:
World Development Indicators
Source organization:
World Bank national accounts data, and OECD National Accounts data files.
Categories, topics:
Economy & Growth
Last updated:
apr 23, 2017
Indicators value changes by year
Maximum:
24.809
jan 1, 2015
At the date of observation
Value
Absolute change
Change from previous value
jan 1, 1986
10.98
+10.98
0.0%
jan 1, 1987
11.609
+0.63
5.73%
jan 1, 1988
12.405
+0.796
6.85%
jan 1, 1989
11.326
-1.079
-8.7%
jan 1, 1990
11.381
+0.055
0.49%
jan 1, 1991
13.359
+1.978
17.38%
jan 1, 1992
15.674
+2.316
17.33%
jan 1, 1993
15.095
-0.579
-3.7%
jan 1, 1994
15.906
+0.811
5.37%
jan 1, 1995
17.626
+1.72
10.81%
jan 1, 1996
18.239
+0.613
3.48%
jan 1, 1997
22.297
+4.058
22.25%
jan 1, 1998
19.632
-2.665
-11.95%
jan 1, 1999
22.38
+2.748
14.0%
jan 1, 2000
20.797
-1.583
-7.07%
jan 1, 2001
19.716
-1.081
-5.2%
jan 1, 2002
20.098
+0.383
1.94%
jan 1, 2003
19.166
-0.932
-4.64%
jan 1, 2004
20.758
+1.592
8.3%
jan 1, 2005
20.09
-0.668
-3.22%
jan 1, 2006
19.913
-0.177
-0.88%
jan 1, 2007
21.076
+1.163
5.84%
jan 1, 2008
21.459
+0.382
1.81%
jan 1, 2009
21.71
+0.251
1.17%
jan 1, 2010
21.176
-0.534
-2.46%
jan 1, 2011
21.445
+0.269
1.27%
jan 1, 2012
23.435
+1.99
9.28%
jan 1, 2013
24.636
+1.2
5.12%
jan 1, 2014
24.598
-0.038
-0.15%
jan 1, 2015
24.809
+0.211
0.86%
jan 1, 2016
22.98
-1.829
-7.37%
Ranking of countries by current statistics by years


Comments: