29
/
en
AIzaSyAYiBZKx7MnpbEhh9jyipgxe19OcubqV5w
April 1, 2024
91188
Brazil
BRA
true
2
1
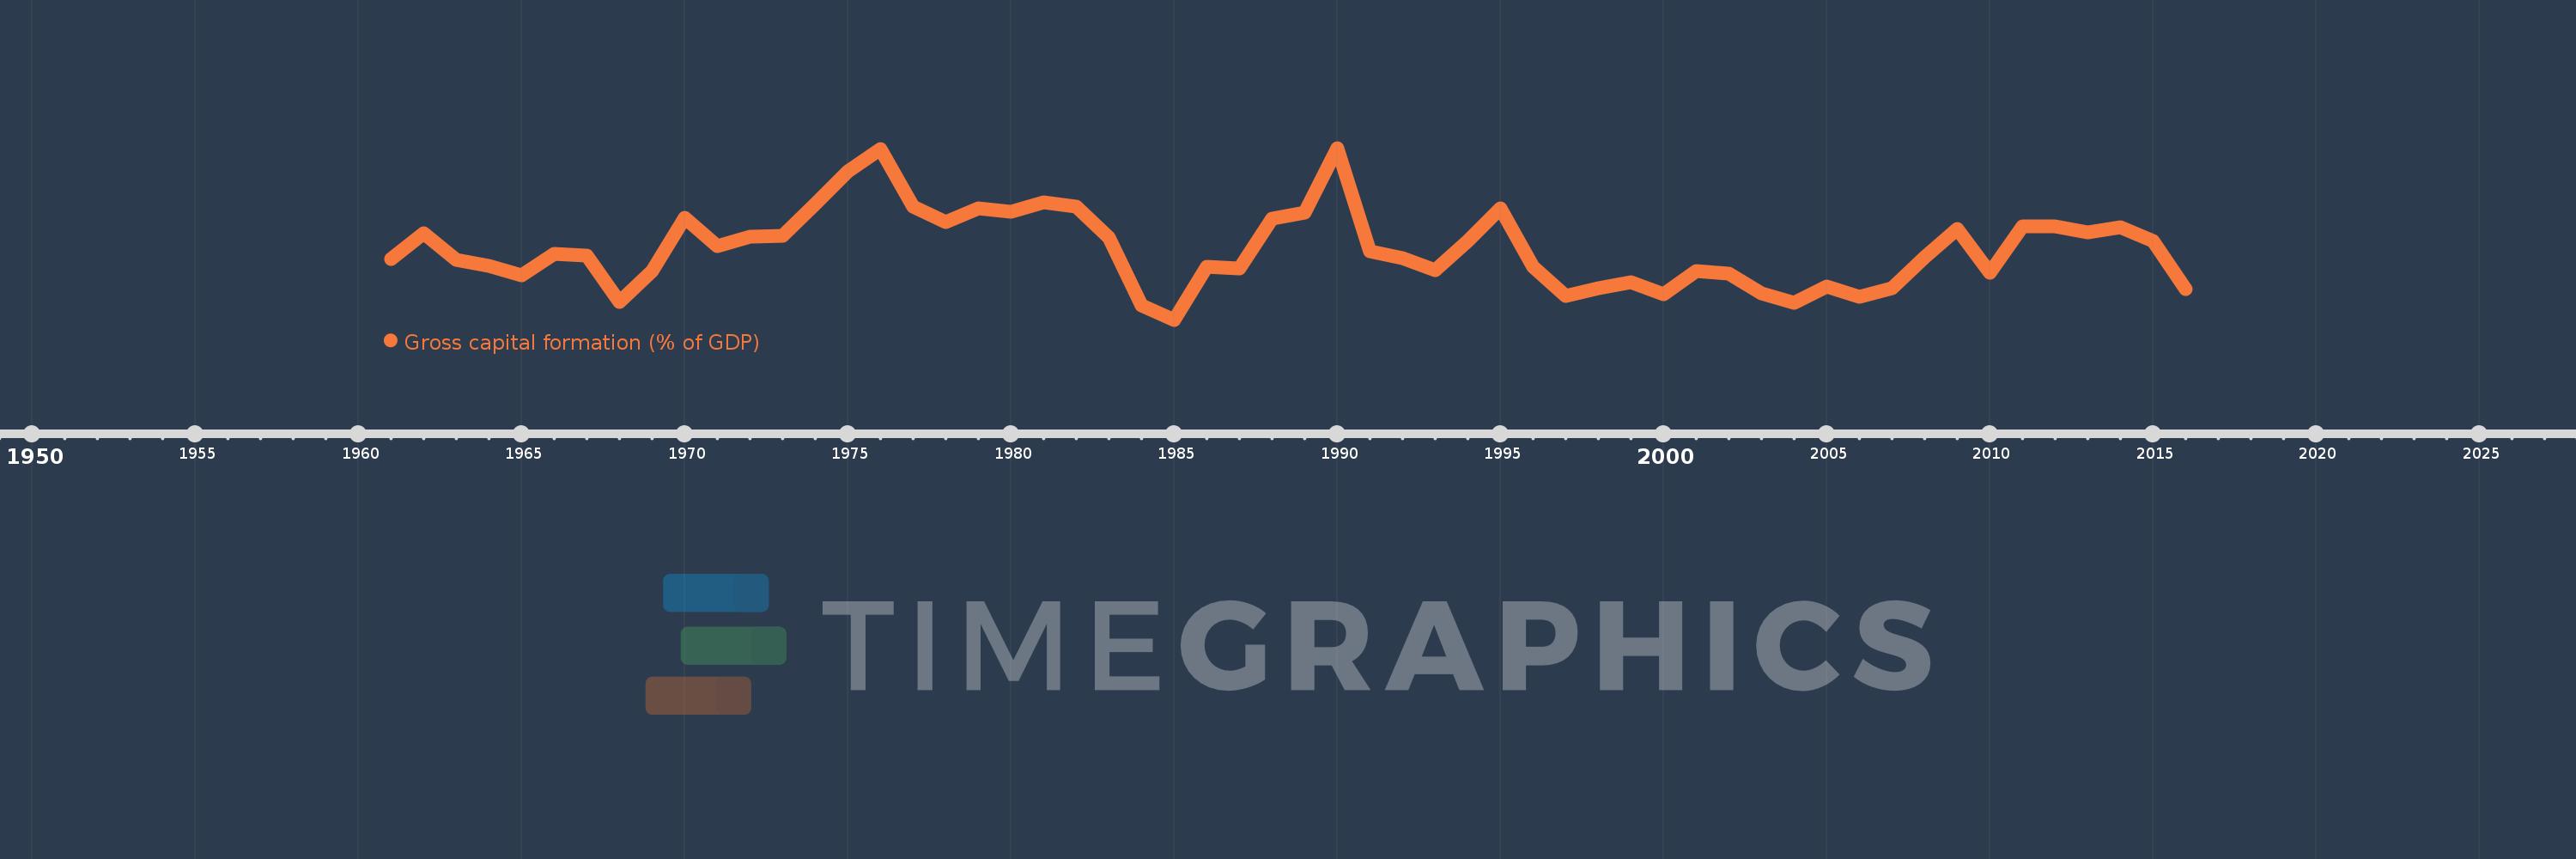
Gross capital formation (% of GDP)
2016,2015,2014,2013,2012,2011,2010,2009,2008,2007,2006,2005,2004,2003,2002,2001,2000,1999,1998,1997,1996,1995,1994,1993,1992,1991,1990,1989,1988,1987,1986,1985,1984,1983,1982,1981,1980,1979,1978,1977,1976,1975,1974,1973,1972,1971,1970,1969,1968,1967,1966,1965,1964,1963,1962,1961
This statistics in other country:
AfghanistanAlbaniaAlgeriaAngolaAntigua and BarbudaArab WorldArgentinaArmeniaArubaAustraliaAustriaAzerbaijanBahamas, TheBahrainBangladeshBarbadosBelarusBelgiumBelizeBeninBermudaBhutanBoliviaBosnia and HerzegovinaBotswanaBrazilBrunei DarussalamBulgariaBurkina FasoBurundiCabo VerdeCambodiaCameroonCanadaCaribbean small statesCentral African RepublicCentral Europe and the BalticsChadChileChinaColombiaComorosCongo, Dem. Rep.Congo, Rep.Costa RicaCote d'IvoireCroatiaCubaCyprusCzech RepublicDenmarkDjiboutiDominicaDominican RepublicEarly-demographic dividendEast Asia & PacificEast Asia & Pacific (excluding high income)East Asia & Pacific (IDA & IBRD countries)EcuadorEgypt, Arab Rep.El SalvadorEquatorial GuineaEritreaEstoniaEthiopiaEuro areaEurope & Central AsiaEurope & Central Asia (excluding high income)Europe & Central Asia (IDA & IBRD countries)European UnionFaroe IslandsFijiFinlandFragile and conflict affected situationsFranceGabonGambia, TheGeorgiaGermanyGhanaGreeceGrenadaGuatemalaGuineaGuinea-BissauGuyanaHaitiHeavily indebted poor countries (HIPC)High incomeHondurasHong Kong SAR, ChinaHungaryIBRD onlyIcelandIDA & IBRD totalIDA blendIDA onlyIDA totalIndiaIndonesiaIran, Islamic Rep.IraqIrelandIsraelItalyJamaicaJapanJordanKazakhstanKenyaKiribatiKorea, Rep.KosovoKuwaitKyrgyz RepublicLao PDRLate-demographic dividendLatin America & Caribbean Latin America & Caribbean (excluding high income)Latin America & the Caribbean (IDA & IBRD countries)LatviaLeast developed countries: UN classificationLebanonLesothoLiberiaLibyaLithuaniaLow & middle incomeLow incomeLower middle incomeLuxembourgMacao SAR, ChinaMacedonia, FYRMadagascarMalawiMalaysiaMaldivesMaliMaltaMauritaniaMauritiusMexicoMicronesia, Fed. Sts.Middle East & North AfricaMiddle East & North Africa (excluding high income)Middle East & North Africa (IDA & IBRD countries)Middle incomeMoldovaMongoliaMontenegroMoroccoMozambiqueNamibiaNepalNetherlandsNew CaledoniaNew ZealandNicaraguaNigerNigeriaNorth AmericaNorwayOECD membersOmanOther small statesPacific island small statesPakistanPanamaPapua New GuineaParaguayPeruPhilippinesPolandPortugalPost-demographic dividendPre-demographic dividendPuerto RicoQatarRomaniaRussian FederationRwandaSaudi ArabiaSenegalSerbiaSeychellesSierra LeoneSingaporeSlovak RepublicSloveniaSmall statesSolomon IslandsSomaliaSouth AfricaSouth AsiaSouth Asia (IDA & IBRD)South SudanSpainSri LankaSt. Kitts and NevisSt. LuciaSt. Vincent and the GrenadinesSub-Saharan Africa Sub-Saharan Africa (excluding high income)Sub-Saharan Africa (IDA & IBRD countries)SudanSurinameSwazilandSwedenSwitzerlandSyrian Arab RepublicTajikistanTanzaniaThailandTimor-LesteTogoTongaTrinidad and TobagoTunisiaTurkeyTurkmenistanUgandaUkraineUnited Arab EmiratesUnited KingdomUnited StatesUpper middle incomeUruguayUzbekistanVanuatuVenezuela, RBVietnamWest Bank and GazaWorldYemen, Rep.ZambiaZimbabwe Timeline:
This timeline shows a graph from 1961 to 2016 of Brazil. No data until 1960. Number of actual observations by date: 56.
Source name:
World Development Indicators
Source organization:
World Bank national accounts data, and OECD National Accounts data files.
Categories, topics:
Economy & Growth
Last updated:
apr 23, 2017
Indicators value changes by year
Minimum:
15.741
jan 1, 1985
Maximum:
26.903
jan 1, 1990
At the date of observation
Value
Absolute change
Change from previous value
jan 1, 1961
19.678
+19.678
0.0%
jan 1, 1962
21.356
+1.678
8.53%
jan 1, 1963
19.605
-1.751
-8.2%
jan 1, 1964
19.26
-0.345
-1.76%
jan 1, 1965
18.602
-0.657
-3.41%
jan 1, 1966
20.024
+1.422
7.64%
jan 1, 1967
19.893
-0.131
-0.65%
jan 1, 1968
16.919
-2.974
-14.95%
jan 1, 1969
18.918
+1.999
11.81%
jan 1, 1970
22.352
+3.435
18.16%
jan 1, 1971
20.542
-1.81
-8.1%
jan 1, 1972
21.118
+0.576
2.8%
jan 1, 1973
21.171
+0.053
0.25%
jan 1, 1974
23.244
+2.073
9.79%
jan 1, 1975
25.389
+2.145
9.23%
jan 1, 1976
26.839
+1.45
5.71%
jan 1, 1977
23.116
-3.723
-13.87%
jan 1, 1978
22.069
-1.047
-4.53%
jan 1, 1979
22.973
+0.904
4.1%
jan 1, 1980
22.764
-0.209
-0.91%
jan 1, 1981
23.346
+0.582
2.56%
jan 1, 1982
23.084
-0.262
-1.12%
jan 1, 1983
21.094
-1.99
-8.62%
jan 1, 1984
16.682
-4.412
-20.91%
jan 1, 1985
15.741
-0.941
-5.64%
jan 1, 1986
19.201
+3.46
21.98%
jan 1, 1987
19.093
-0.108
-0.56%
jan 1, 1988
22.305
+3.212
16.82%
jan 1, 1989
22.719
+0.414
1.86%
jan 1, 1990
26.903
+4.184
18.42%
jan 1, 1991
20.167
-6.736
-25.04%
jan 1, 1992
19.769
-0.398
-1.97%
jan 1, 1993
18.935
-0.834
-4.22%
jan 1, 1994
20.846
+1.912
10.1%
jan 1, 1995
22.993
+2.147
10.3%
jan 1, 1996
19.178
-3.816
-16.6%
jan 1, 1997
17.267
-1.911
-9.96%
jan 1, 1998
17.764
+0.497
2.88%
jan 1, 1999
18.165
+0.401
2.26%
jan 1, 2000
17.39
-0.775
-4.27%
jan 1, 2001
18.903
+1.514
8.7%
jan 1, 2002
18.742
-0.161
-0.85%
jan 1, 2003
17.449
-1.293
-6.9%
jan 1, 2004
16.857
-0.592
-3.39%
jan 1, 2005
17.913
+1.056
6.26%
jan 1, 2006
17.205
-0.708
-3.95%
jan 1, 2007
17.817
+0.612
3.56%
jan 1, 2008
19.819
+2.003
11.24%
jan 1, 2009
21.619
+1.8
9.08%
jan 1, 2010
18.796
-2.823
-13.06%
jan 1, 2011
21.801
+3.005
15.99%
jan 1, 2012
21.814
+0.012
0.06%
jan 1, 2013
21.412
-0.401
-1.84%
jan 1, 2014
21.731
+0.319
1.49%
jan 1, 2015
20.865
-0.867
-3.99%
jan 1, 2016
17.712
-3.153
-15.11%
Ranking of countries by current statistics by years


Comments: