29
/
en
AIzaSyAYiBZKx7MnpbEhh9jyipgxe19OcubqV5w
April 1, 2024
194269
Mauritius
MUS
true
2
1
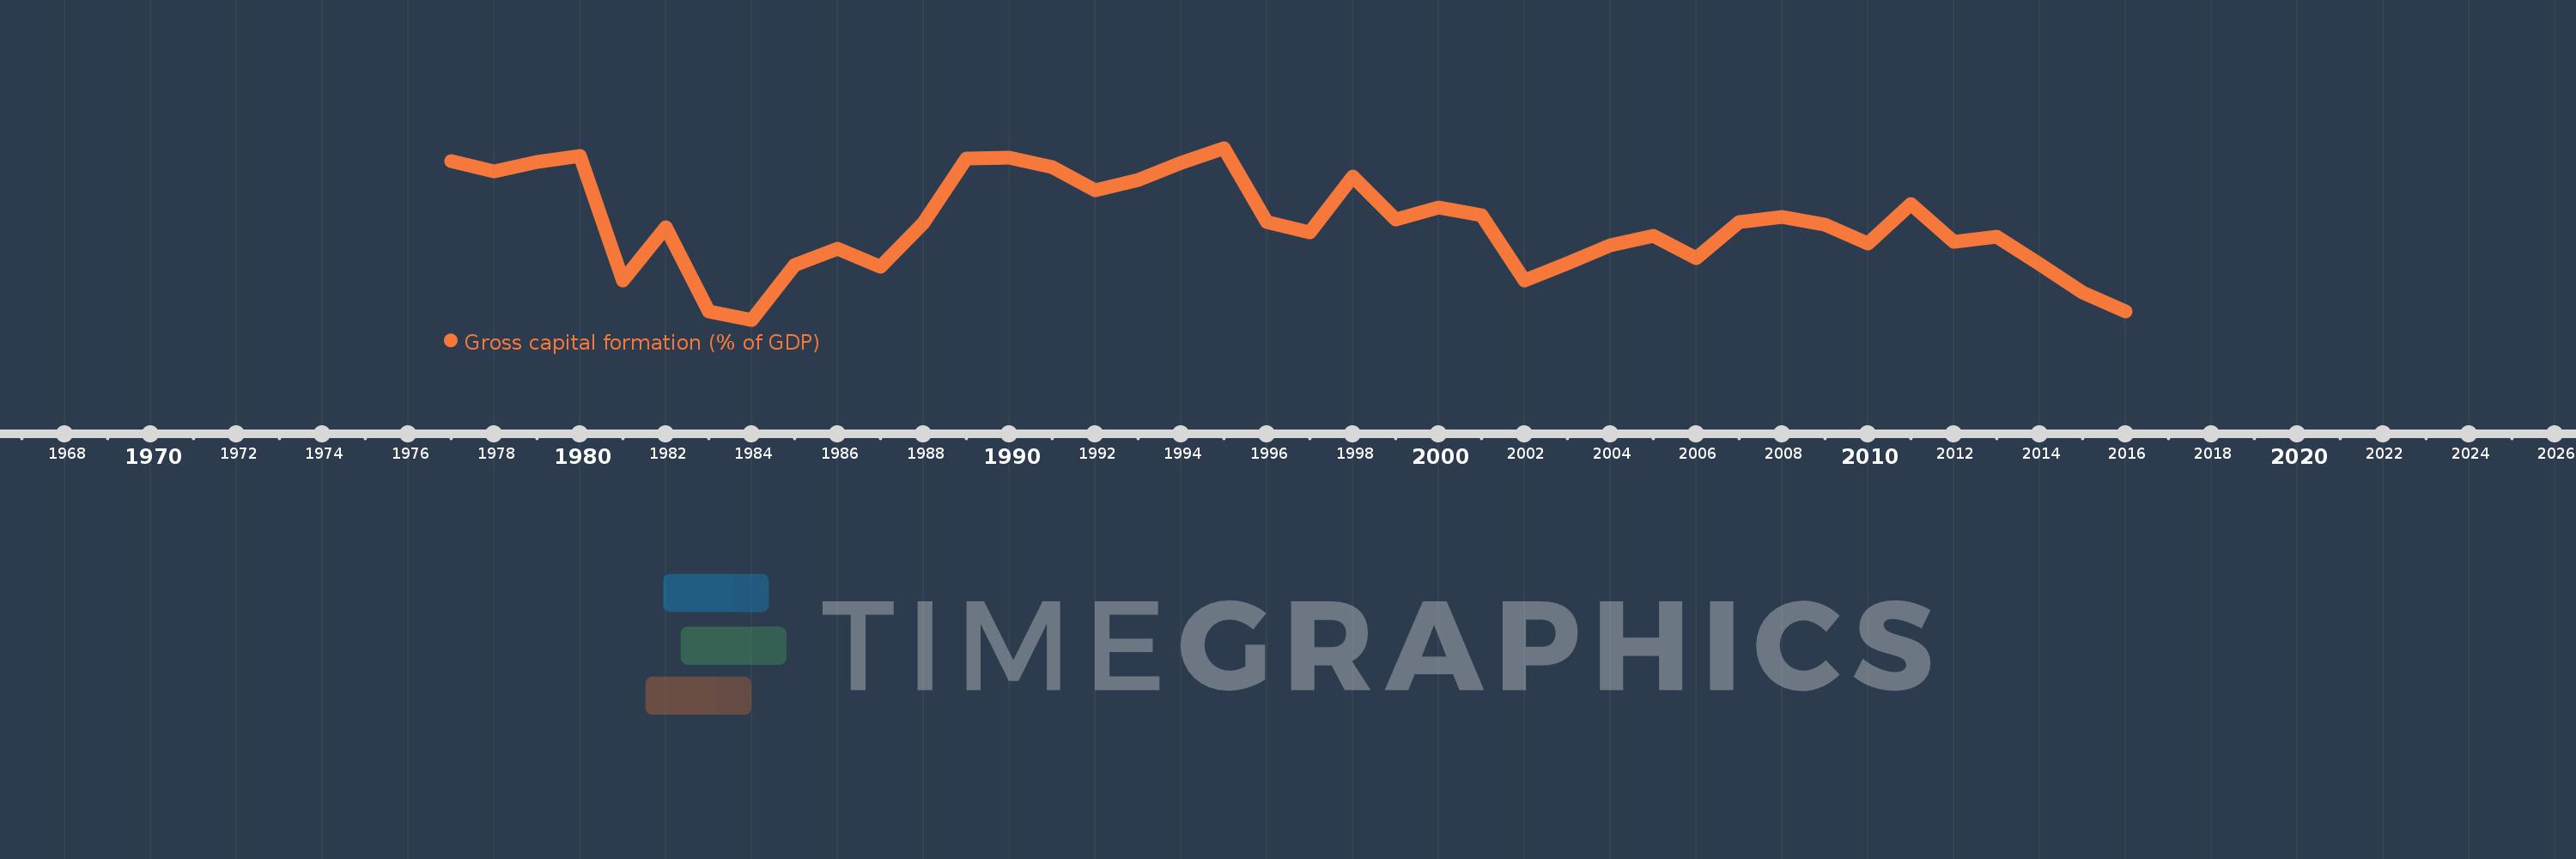
Gross capital formation (% of GDP)
2016,2015,2014,2013,2012,2011,2010,2009,2008,2007,2006,2005,2004,2003,2002,2001,2000,1999,1998,1997,1996,1995,1994,1993,1992,1991,1990,1989,1988,1987,1986,1985,1984,1983,1982,1981,1980,1979,1978,1977
This statistics in other country:
AfghanistanAlbaniaAlgeriaAngolaAntigua and BarbudaArab WorldArgentinaArmeniaArubaAustraliaAustriaAzerbaijanBahamas, TheBahrainBangladeshBarbadosBelarusBelgiumBelizeBeninBermudaBhutanBoliviaBosnia and HerzegovinaBotswanaBrazilBrunei DarussalamBulgariaBurkina FasoBurundiCabo VerdeCambodiaCameroonCanadaCaribbean small statesCentral African RepublicCentral Europe and the BalticsChadChileChinaColombiaComorosCongo, Dem. Rep.Congo, Rep.Costa RicaCote d'IvoireCroatiaCubaCyprusCzech RepublicDenmarkDjiboutiDominicaDominican RepublicEarly-demographic dividendEast Asia & PacificEast Asia & Pacific (excluding high income)East Asia & Pacific (IDA & IBRD countries)EcuadorEgypt, Arab Rep.El SalvadorEquatorial GuineaEritreaEstoniaEthiopiaEuro areaEurope & Central AsiaEurope & Central Asia (excluding high income)Europe & Central Asia (IDA & IBRD countries)European UnionFaroe IslandsFijiFinlandFragile and conflict affected situationsFranceGabonGambia, TheGeorgiaGermanyGhanaGreeceGrenadaGuatemalaGuineaGuinea-BissauGuyanaHaitiHeavily indebted poor countries (HIPC)High incomeHondurasHong Kong SAR, ChinaHungaryIBRD onlyIcelandIDA & IBRD totalIDA blendIDA onlyIDA totalIndiaIndonesiaIran, Islamic Rep.IraqIrelandIsraelItalyJamaicaJapanJordanKazakhstanKenyaKiribatiKorea, Rep.KosovoKuwaitKyrgyz RepublicLao PDRLate-demographic dividendLatin America & Caribbean Latin America & Caribbean (excluding high income)Latin America & the Caribbean (IDA & IBRD countries)LatviaLeast developed countries: UN classificationLebanonLesothoLiberiaLibyaLithuaniaLow & middle incomeLow incomeLower middle incomeLuxembourgMacao SAR, ChinaMacedonia, FYRMadagascarMalawiMalaysiaMaldivesMaliMaltaMauritaniaMauritiusMexicoMicronesia, Fed. Sts.Middle East & North AfricaMiddle East & North Africa (excluding high income)Middle East & North Africa (IDA & IBRD countries)Middle incomeMoldovaMongoliaMontenegroMoroccoMozambiqueNamibiaNepalNetherlandsNew CaledoniaNew ZealandNicaraguaNigerNigeriaNorth AmericaNorwayOECD membersOmanOther small statesPacific island small statesPakistanPanamaPapua New GuineaParaguayPeruPhilippinesPolandPortugalPost-demographic dividendPre-demographic dividendPuerto RicoQatarRomaniaRussian FederationRwandaSaudi ArabiaSenegalSerbiaSeychellesSierra LeoneSingaporeSlovak RepublicSloveniaSmall statesSolomon IslandsSomaliaSouth AfricaSouth AsiaSouth Asia (IDA & IBRD)South SudanSpainSri LankaSt. Kitts and NevisSt. LuciaSt. Vincent and the GrenadinesSub-Saharan Africa Sub-Saharan Africa (excluding high income)Sub-Saharan Africa (IDA & IBRD countries)SudanSurinameSwazilandSwedenSwitzerlandSyrian Arab RepublicTajikistanTanzaniaThailandTimor-LesteTogoTongaTrinidad and TobagoTunisiaTurkeyTurkmenistanUgandaUkraineUnited Arab EmiratesUnited KingdomUnited StatesUpper middle incomeUruguayUzbekistanVanuatuVenezuela, RBVietnamWest Bank and GazaWorldYemen, Rep.ZambiaZimbabwe Timeline:
This timeline shows a graph from 1977 to 2016 of Mauritius. No data until 1976. Number of actual observations by date: 40.
Source name:
World Development Indicators
Source organization:
World Bank national accounts data, and OECD National Accounts data files.
Categories, topics:
Economy & Growth
Last updated:
apr 23, 2017
Indicators value changes by year
Minimum:
17.391
jan 1, 1984
Maximum:
31.779
jan 1, 1995
At the date of observation
Value
Absolute change
Change from previous value
jan 1, 1977
30.675
+30.675
0.0%
jan 1, 1978
29.827
-0.848
-2.76%
jan 1, 1979
30.6
+0.773
2.59%
jan 1, 1980
31.087
+0.487
1.59%
jan 1, 1981
20.645
-10.442
-33.59%
jan 1, 1982
25.147
+4.502
21.81%
jan 1, 1983
18.09
-7.056
-28.06%
jan 1, 1984
17.391
-0.699
-3.86%
jan 1, 1985
21.948
+4.557
26.2%
jan 1, 1986
23.37
+1.422
6.48%
jan 1, 1987
21.837
-1.533
-6.56%
jan 1, 1988
25.485
+3.648
16.71%
jan 1, 1989
30.889
+5.403
21.2%
jan 1, 1990
30.987
+0.099
0.32%
jan 1, 1991
30.21
-0.777
-2.51%
jan 1, 1992
28.222
-1.989
-6.58%
jan 1, 1993
29.067
+0.845
2.99%
jan 1, 1994
30.54
+1.473
5.07%
jan 1, 1995
31.779
+1.24
4.06%
jan 1, 1996
25.58
-6.199
-19.51%
jan 1, 1997
24.679
-0.902
-3.53%
jan 1, 1998
29.389
+4.71
19.09%
jan 1, 1999
25.779
-3.61
-12.28%
jan 1, 2000
26.774
+0.995
3.86%
jan 1, 2001
26.138
-0.636
-2.38%
jan 1, 2002
20.697
-5.441
-20.82%
jan 1, 2003
22.092
+1.395
6.74%
jan 1, 2004
23.599
+1.507
6.82%
jan 1, 2005
24.421
+0.821
3.48%
jan 1, 2006
22.53
-1.891
-7.75%
jan 1, 2007
25.573
+3.044
13.51%
jan 1, 2008
25.986
+0.412
1.61%
jan 1, 2009
25.346
-0.64
-2.46%
jan 1, 2010
23.766
-1.58
-6.23%
jan 1, 2011
27.105
+3.34
14.05%
jan 1, 2012
23.946
-3.159
-11.65%
jan 1, 2013
24.381
+0.434
1.81%
jan 1, 2014
22.032
-2.348
-9.63%
jan 1, 2015
19.676
-2.356
-10.7%
jan 1, 2016
18.107
-1.568
-7.97%
Ranking of countries by current statistics by years


Comments: