29
/
en
AIzaSyAYiBZKx7MnpbEhh9jyipgxe19OcubqV5w
April 1, 2024
216468
Pakistan
PAK
true
2
1
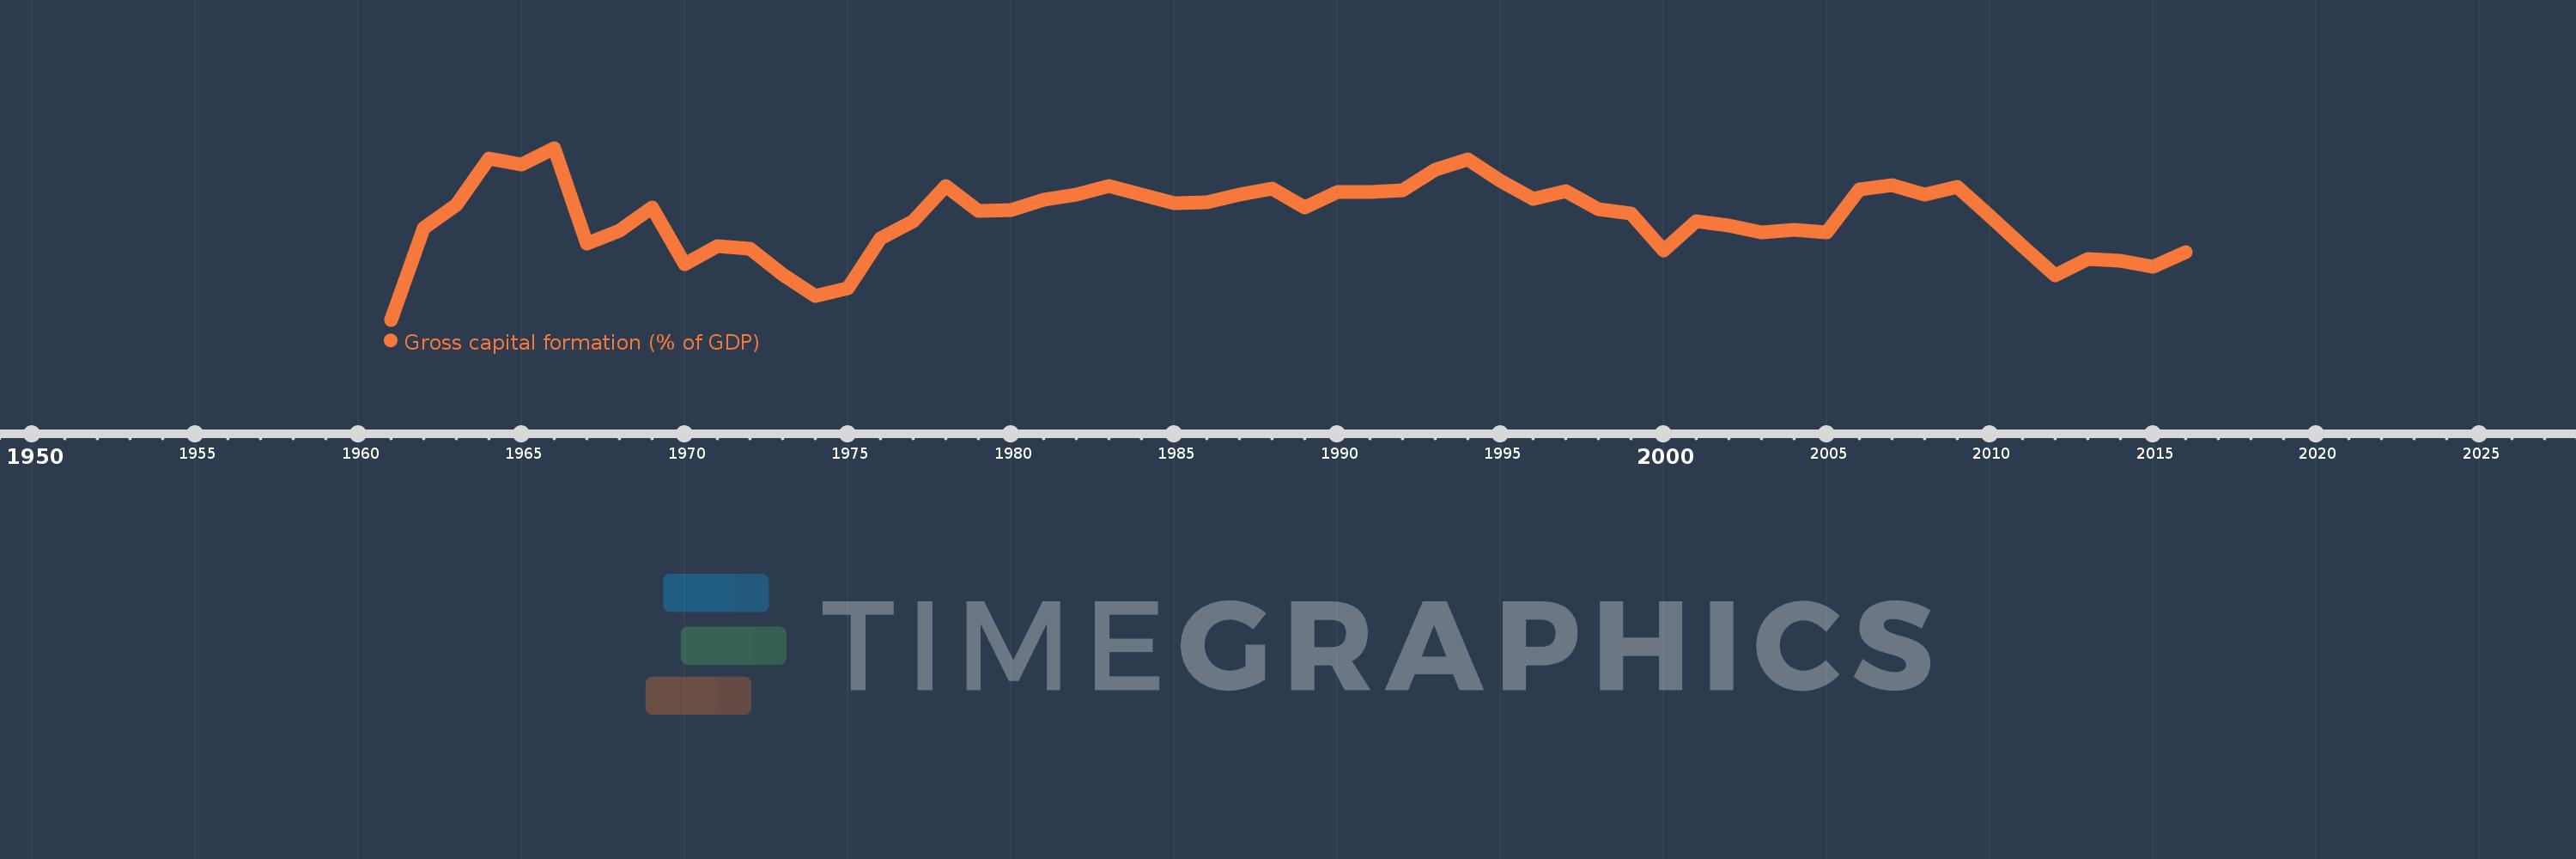
Gross capital formation (% of GDP)
2016,2015,2014,2013,2012,2011,2010,2009,2008,2007,2006,2005,2004,2003,2002,2001,2000,1999,1998,1997,1996,1995,1994,1993,1992,1991,1990,1989,1988,1987,1986,1985,1984,1983,1982,1981,1980,1979,1978,1977,1976,1975,1974,1973,1972,1971,1970,1969,1968,1967,1966,1965,1964,1963,1962,1961
This statistics in other country:
AfghanistanAlbaniaAlgeriaAngolaAntigua and BarbudaArab WorldArgentinaArmeniaArubaAustraliaAustriaAzerbaijanBahamas, TheBahrainBangladeshBarbadosBelarusBelgiumBelizeBeninBermudaBhutanBoliviaBosnia and HerzegovinaBotswanaBrazilBrunei DarussalamBulgariaBurkina FasoBurundiCabo VerdeCambodiaCameroonCanadaCaribbean small statesCentral African RepublicCentral Europe and the BalticsChadChileChinaColombiaComorosCongo, Dem. Rep.Congo, Rep.Costa RicaCote d'IvoireCroatiaCubaCyprusCzech RepublicDenmarkDjiboutiDominicaDominican RepublicEarly-demographic dividendEast Asia & PacificEast Asia & Pacific (excluding high income)East Asia & Pacific (IDA & IBRD countries)EcuadorEgypt, Arab Rep.El SalvadorEquatorial GuineaEritreaEstoniaEthiopiaEuro areaEurope & Central AsiaEurope & Central Asia (excluding high income)Europe & Central Asia (IDA & IBRD countries)European UnionFaroe IslandsFijiFinlandFragile and conflict affected situationsFranceGabonGambia, TheGeorgiaGermanyGhanaGreeceGrenadaGuatemalaGuineaGuinea-BissauGuyanaHaitiHeavily indebted poor countries (HIPC)High incomeHondurasHong Kong SAR, ChinaHungaryIBRD onlyIcelandIDA & IBRD totalIDA blendIDA onlyIDA totalIndiaIndonesiaIran, Islamic Rep.IraqIrelandIsraelItalyJamaicaJapanJordanKazakhstanKenyaKiribatiKorea, Rep.KosovoKuwaitKyrgyz RepublicLao PDRLate-demographic dividendLatin America & Caribbean Latin America & Caribbean (excluding high income)Latin America & the Caribbean (IDA & IBRD countries)LatviaLeast developed countries: UN classificationLebanonLesothoLiberiaLibyaLithuaniaLow & middle incomeLow incomeLower middle incomeLuxembourgMacao SAR, ChinaMacedonia, FYRMadagascarMalawiMalaysiaMaldivesMaliMaltaMauritaniaMauritiusMexicoMicronesia, Fed. Sts.Middle East & North AfricaMiddle East & North Africa (excluding high income)Middle East & North Africa (IDA & IBRD countries)Middle incomeMoldovaMongoliaMontenegroMoroccoMozambiqueNamibiaNepalNetherlandsNew CaledoniaNew ZealandNicaraguaNigerNigeriaNorth AmericaNorwayOECD membersOmanOther small statesPacific island small statesPakistanPanamaPapua New GuineaParaguayPeruPhilippinesPolandPortugalPost-demographic dividendPre-demographic dividendPuerto RicoQatarRomaniaRussian FederationRwandaSaudi ArabiaSenegalSerbiaSeychellesSierra LeoneSingaporeSlovak RepublicSloveniaSmall statesSolomon IslandsSomaliaSouth AfricaSouth AsiaSouth Asia (IDA & IBRD)South SudanSpainSri LankaSt. Kitts and NevisSt. LuciaSt. Vincent and the GrenadinesSub-Saharan Africa Sub-Saharan Africa (excluding high income)Sub-Saharan Africa (IDA & IBRD countries)SudanSurinameSwazilandSwedenSwitzerlandSyrian Arab RepublicTajikistanTanzaniaThailandTimor-LesteTogoTongaTrinidad and TobagoTunisiaTurkeyTurkmenistanUgandaUkraineUnited Arab EmiratesUnited KingdomUnited StatesUpper middle incomeUruguayUzbekistanVanuatuVenezuela, RBVietnamWest Bank and GazaWorldYemen, Rep.ZambiaZimbabwe Timeline:
This timeline shows a graph from 1961 to 2016 of Pakistan. No data until 1960. Number of actual observations by date: 56.
Source name:
World Development Indicators
Source organization:
World Bank national accounts data, and OECD National Accounts data files.
Categories, topics:
Economy & Growth
Last updated:
apr 23, 2017
Indicators value changes by year
Minimum:
11.556
jan 1, 1961
Maximum:
21.468
jan 1, 1966
At the date of observation
Value
Absolute change
Change from previous value
jan 1, 1961
11.556
+11.556
0.0%
jan 1, 1962
16.864
+5.307
45.93%
jan 1, 1963
18.181
+1.318
7.82%
jan 1, 1964
20.882
+2.7
14.85%
jan 1, 1965
20.515
-0.367
-1.76%
jan 1, 1966
21.468
+0.953
4.65%
jan 1, 1967
15.961
-5.507
-25.65%
jan 1, 1968
16.7
+0.739
4.63%
jan 1, 1969
18.019
+1.319
7.9%
jan 1, 1970
14.753
-3.266
-18.13%
jan 1, 1971
15.793
+1.04
7.05%
jan 1, 1972
15.632
-0.161
-1.02%
jan 1, 1973
14.176
-1.456
-9.32%
jan 1, 1974
12.93
-1.245
-8.78%
jan 1, 1975
13.372
+0.442
3.41%
jan 1, 1976
16.228
+2.856
21.35%
jan 1, 1977
17.243
+1.016
6.26%
jan 1, 1978
19.27
+2.026
11.75%
jan 1, 1979
17.858
-1.412
-7.33%
jan 1, 1980
17.875
+0.017
0.1%
jan 1, 1981
18.482
+0.607
3.39%
jan 1, 1982
18.774
+0.292
1.58%
jan 1, 1983
19.261
+0.487
2.59%
jan 1, 1984
18.8
-0.461
-2.4%
jan 1, 1985
18.271
-0.529
-2.82%
jan 1, 1986
18.32
+0.05
0.27%
jan 1, 1987
18.774
+0.454
2.48%
jan 1, 1988
19.134
+0.36
1.92%
jan 1, 1989
18.014
-1.12
-5.85%
jan 1, 1990
18.911
+0.897
4.98%
jan 1, 1991
18.935
+0.024
0.13%
jan 1, 1992
19.026
+0.091
0.48%
jan 1, 1993
20.237
+1.21
6.36%
jan 1, 1994
20.818
+0.582
2.87%
jan 1, 1995
19.546
-1.272
-6.11%
jan 1, 1996
18.546
-1.001
-5.12%
jan 1, 1997
18.997
+0.451
2.43%
jan 1, 1998
17.919
-1.077
-5.67%
jan 1, 1999
17.711
-0.208
-1.16%
jan 1, 2000
15.565
-2.146
-12.12%
jan 1, 2001
17.227
+1.662
10.68%
jan 1, 2002
16.996
-0.23
-1.34%
jan 1, 2003
16.583
-0.414
-2.43%
jan 1, 2004
16.758
+0.175
1.06%
jan 1, 2005
16.578
-0.18
-1.07%
jan 1, 2006
19.081
+2.503
15.1%
jan 1, 2007
19.332
+0.251
1.31%
jan 1, 2008
18.787
-0.545
-2.82%
jan 1, 2009
19.206
+0.419
2.23%
jan 1, 2010
17.549
-1.656
-8.62%
jan 1, 2011
15.805
-1.745
-9.94%
jan 1, 2012
14.121
-1.684
-10.65%
jan 1, 2013
15.076
+0.955
6.77%
jan 1, 2014
14.957
-0.119
-0.79%
jan 1, 2015
14.635
-0.322
-2.15%
jan 1, 2016
15.479
+0.844
5.77%
Ranking of countries by current statistics by years


Comments: