29
/
en
AIzaSyAYiBZKx7MnpbEhh9jyipgxe19OcubqV5w
April 1, 2024
46132
Low income
LIC
false
2
1
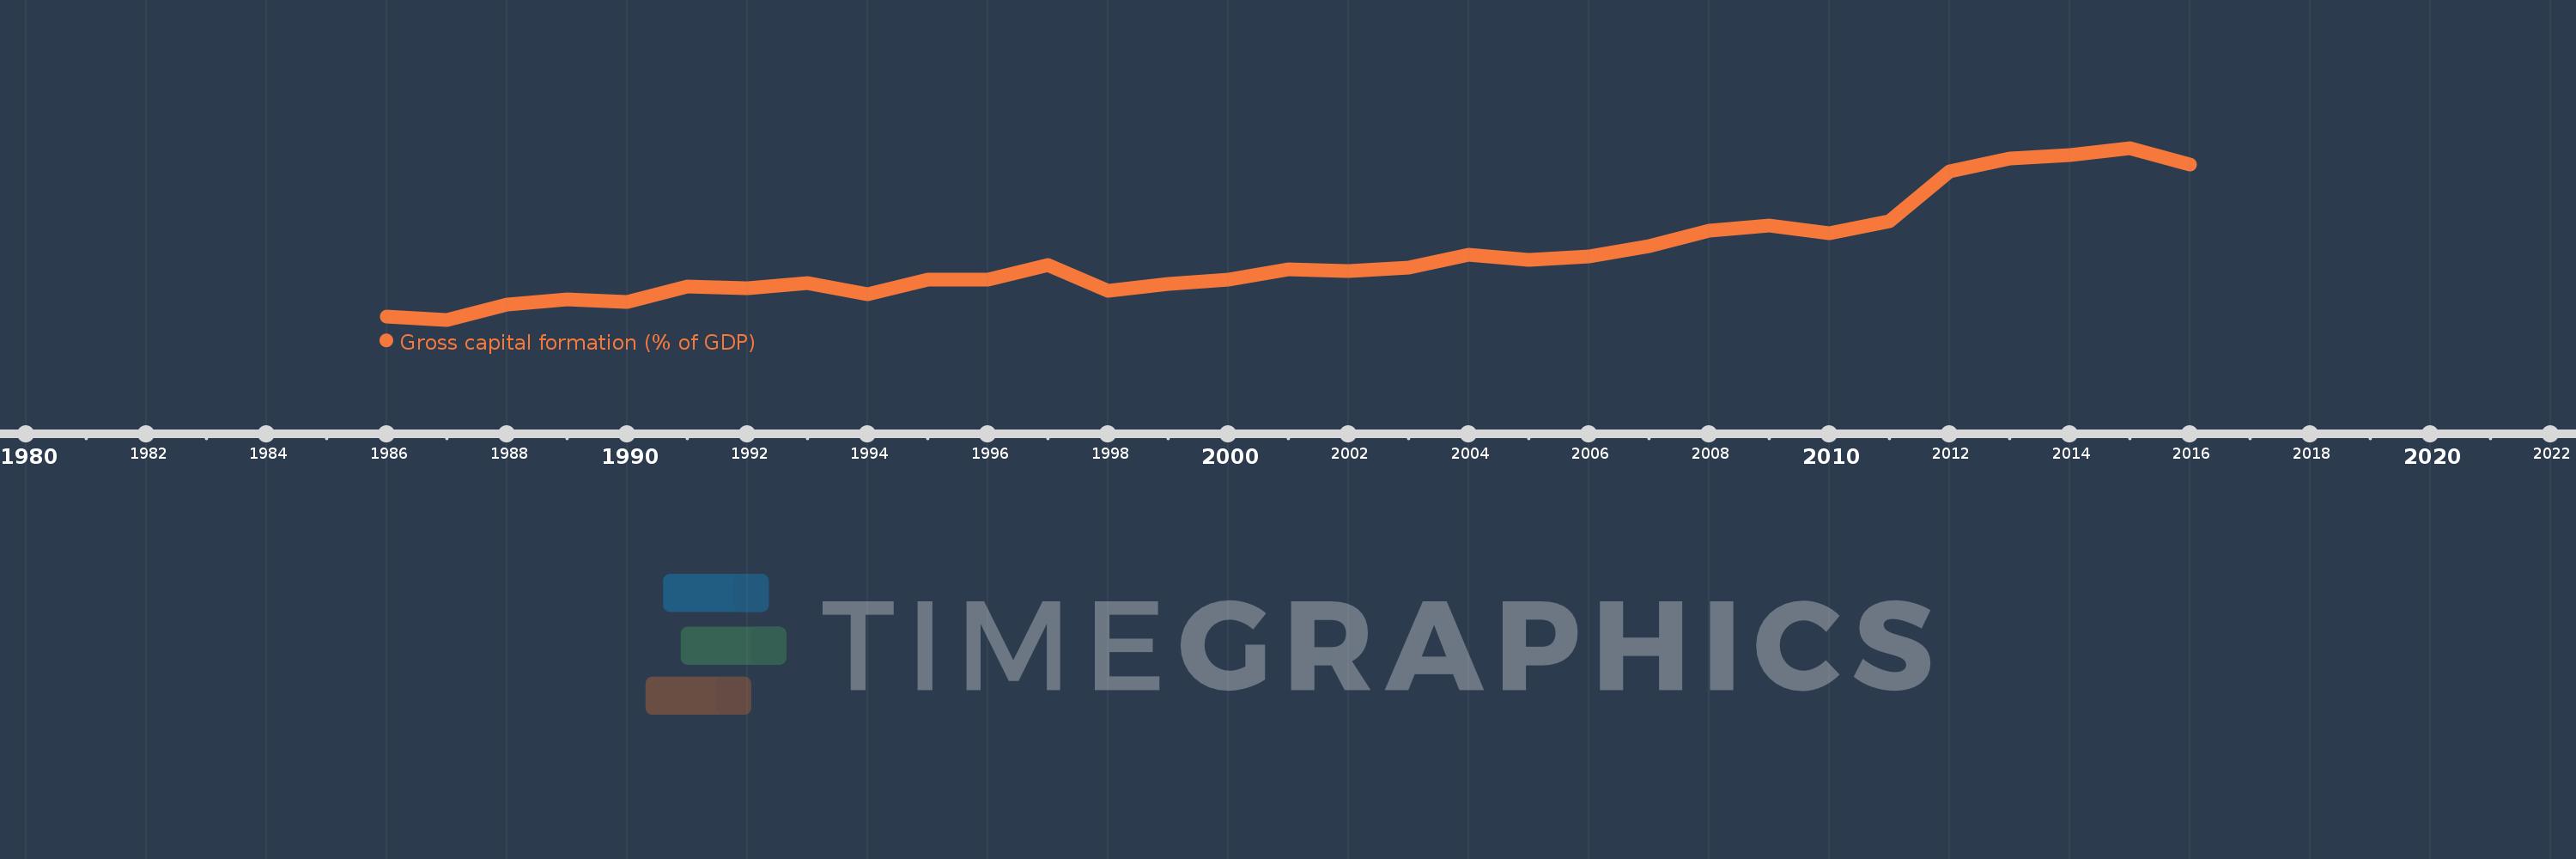
Gross capital formation (% of GDP)
2016,2015,2014,2013,2012,2011,2010,2009,2008,2007,2006,2005,2004,2003,2002,2001,2000,1999,1998,1997,1996,1995,1994,1993,1992,1991,1990,1989,1988,1987,1986
This statistics in other country:
AfghanistanAlbaniaAlgeriaAngolaAntigua and BarbudaArab WorldArgentinaArmeniaArubaAustraliaAustriaAzerbaijanBahamas, TheBahrainBangladeshBarbadosBelarusBelgiumBelizeBeninBermudaBhutanBoliviaBosnia and HerzegovinaBotswanaBrazilBrunei DarussalamBulgariaBurkina FasoBurundiCabo VerdeCambodiaCameroonCanadaCaribbean small statesCentral African RepublicCentral Europe and the BalticsChadChileChinaColombiaComorosCongo, Dem. Rep.Congo, Rep.Costa RicaCote d'IvoireCroatiaCubaCyprusCzech RepublicDenmarkDjiboutiDominicaDominican RepublicEarly-demographic dividendEast Asia & PacificEast Asia & Pacific (excluding high income)East Asia & Pacific (IDA & IBRD countries)EcuadorEgypt, Arab Rep.El SalvadorEquatorial GuineaEritreaEstoniaEthiopiaEuro areaEurope & Central AsiaEurope & Central Asia (excluding high income)Europe & Central Asia (IDA & IBRD countries)European UnionFaroe IslandsFijiFinlandFragile and conflict affected situationsFranceGabonGambia, TheGeorgiaGermanyGhanaGreeceGrenadaGuatemalaGuineaGuinea-BissauGuyanaHaitiHeavily indebted poor countries (HIPC)High incomeHondurasHong Kong SAR, ChinaHungaryIBRD onlyIcelandIDA & IBRD totalIDA blendIDA onlyIDA totalIndiaIndonesiaIran, Islamic Rep.IraqIrelandIsraelItalyJamaicaJapanJordanKazakhstanKenyaKiribatiKorea, Rep.KosovoKuwaitKyrgyz RepublicLao PDRLate-demographic dividendLatin America & Caribbean Latin America & Caribbean (excluding high income)Latin America & the Caribbean (IDA & IBRD countries)LatviaLeast developed countries: UN classificationLebanonLesothoLiberiaLibyaLithuaniaLow & middle incomeLow incomeLower middle incomeLuxembourgMacao SAR, ChinaMacedonia, FYRMadagascarMalawiMalaysiaMaldivesMaliMaltaMauritaniaMauritiusMexicoMicronesia, Fed. Sts.Middle East & North AfricaMiddle East & North Africa (excluding high income)Middle East & North Africa (IDA & IBRD countries)Middle incomeMoldovaMongoliaMontenegroMoroccoMozambiqueNamibiaNepalNetherlandsNew CaledoniaNew ZealandNicaraguaNigerNigeriaNorth AmericaNorwayOECD membersOmanOther small statesPacific island small statesPakistanPanamaPapua New GuineaParaguayPeruPhilippinesPolandPortugalPost-demographic dividendPre-demographic dividendPuerto RicoQatarRomaniaRussian FederationRwandaSaudi ArabiaSenegalSerbiaSeychellesSierra LeoneSingaporeSlovak RepublicSloveniaSmall statesSolomon IslandsSomaliaSouth AfricaSouth AsiaSouth Asia (IDA & IBRD)South SudanSpainSri LankaSt. Kitts and NevisSt. LuciaSt. Vincent and the GrenadinesSub-Saharan Africa Sub-Saharan Africa (excluding high income)Sub-Saharan Africa (IDA & IBRD countries)SudanSurinameSwazilandSwedenSwitzerlandSyrian Arab RepublicTajikistanTanzaniaThailandTimor-LesteTogoTongaTrinidad and TobagoTunisiaTurkeyTurkmenistanUgandaUkraineUnited Arab EmiratesUnited KingdomUnited StatesUpper middle incomeUruguayUzbekistanVanuatuVenezuela, RBVietnamWest Bank and GazaWorldYemen, Rep.ZambiaZimbabwe Timeline:
This timeline shows a graph from 1986 to 2016 of Low income. No data until 1985. Number of actual observations by date: 31.
Source name:
World Development Indicators
Source organization:
World Bank national accounts data, and OECD National Accounts data files.
Categories, topics:
Economy & Growth
Last updated:
apr 23, 2017
Indicators value changes by year
Minimum:
11.047
jan 1, 1987
Maximum:
27.867
jan 1, 2015
At the date of observation
Value
Absolute change
Change from previous value
jan 1, 1986
11.333
+11.333
0.0%
jan 1, 1987
11.047
-0.286
-2.53%
jan 1, 1988
12.523
+1.476
13.36%
jan 1, 1989
13.006
+0.483
3.86%
jan 1, 1990
12.81
-0.196
-1.5%
jan 1, 1991
14.329
+1.519
11.86%
jan 1, 1992
14.116
-0.213
-1.49%
jan 1, 1993
14.679
+0.563
3.99%
jan 1, 1994
13.586
-1.093
-7.44%
jan 1, 1995
14.964
+1.378
10.14%
jan 1, 1996
14.935
-0.029
-0.19%
jan 1, 1997
16.402
+1.466
9.82%
jan 1, 1998
13.842
-2.559
-15.6%
jan 1, 1999
14.565
+0.722
5.22%
jan 1, 2000
14.96
+0.395
2.71%
jan 1, 2001
15.976
+1.016
6.79%
jan 1, 2002
15.804
-0.172
-1.08%
jan 1, 2003
16.166
+0.362
2.29%
jan 1, 2004
17.406
+1.241
7.67%
jan 1, 2005
16.925
-0.481
-2.76%
jan 1, 2006
17.284
+0.359
2.12%
jan 1, 2007
18.235
+0.951
5.5%
jan 1, 2008
19.767
+1.532
8.4%
jan 1, 2009
20.241
+0.474
2.4%
jan 1, 2010
19.489
-0.752
-3.72%
jan 1, 2011
20.686
+1.197
6.14%
jan 1, 2012
25.556
+4.871
23.55%
jan 1, 2013
26.847
+1.291
5.05%
jan 1, 2014
27.144
+0.297
1.1%
jan 1, 2015
27.867
+0.723
2.67%
jan 1, 2016
26.283
-1.584
-5.69%
Ranking of countries by current statistics by years


Comments: