29
/
en
AIzaSyAYiBZKx7MnpbEhh9jyipgxe19OcubqV5w
April 1, 2024
218381
Panama
PAN
true
2
1
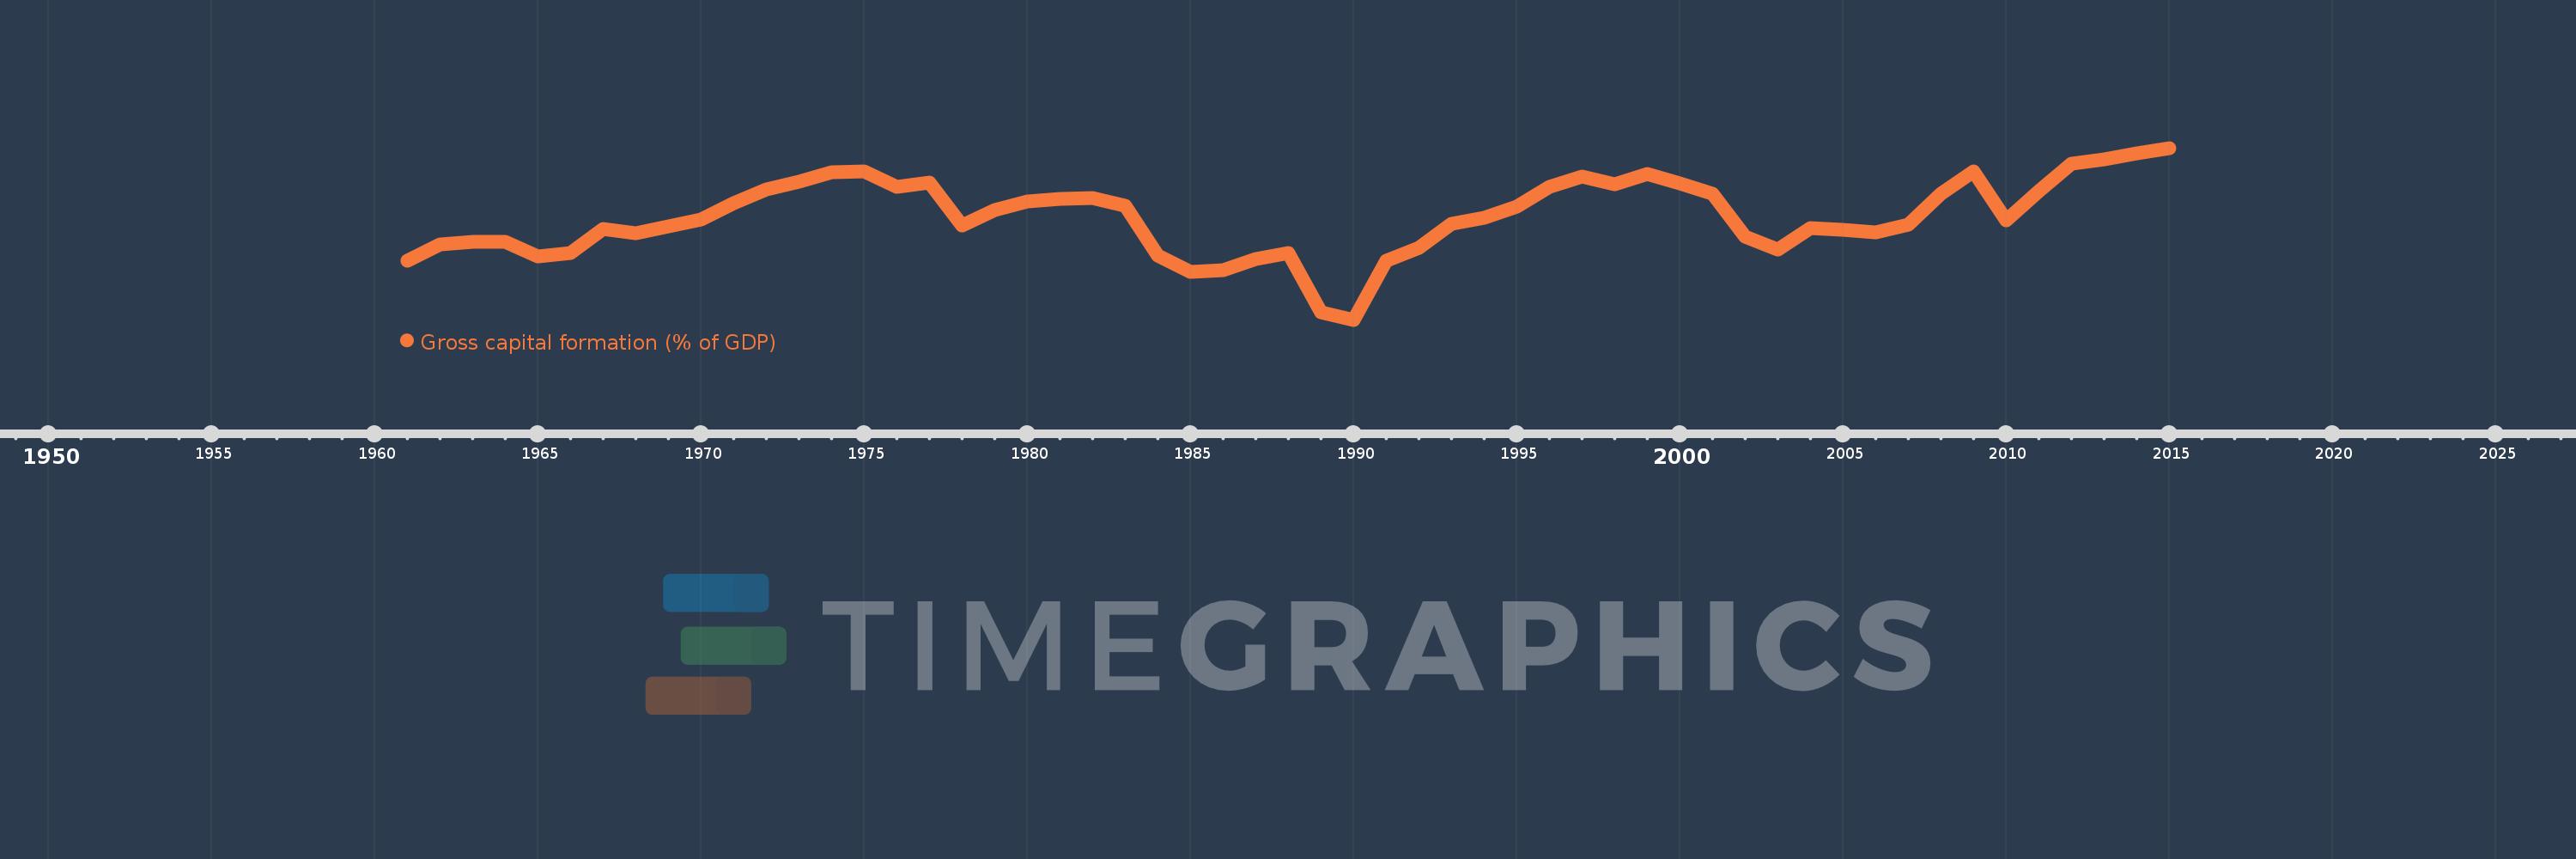
Gross capital formation (% of GDP)
2015,2014,2013,2012,2011,2010,2009,2008,2007,2006,2005,2004,2003,2002,2001,2000,1999,1998,1997,1996,1995,1994,1993,1992,1991,1990,1989,1988,1987,1986,1985,1984,1983,1982,1981,1980,1979,1978,1977,1976,1975,1974,1973,1972,1971,1970,1969,1968,1967,1966,1965,1964,1963,1962,1961
This statistics in other country:
AfghanistanAlbaniaAlgeriaAngolaAntigua and BarbudaArab WorldArgentinaArmeniaArubaAustraliaAustriaAzerbaijanBahamas, TheBahrainBangladeshBarbadosBelarusBelgiumBelizeBeninBermudaBhutanBoliviaBosnia and HerzegovinaBotswanaBrazilBrunei DarussalamBulgariaBurkina FasoBurundiCabo VerdeCambodiaCameroonCanadaCaribbean small statesCentral African RepublicCentral Europe and the BalticsChadChileChinaColombiaComorosCongo, Dem. Rep.Congo, Rep.Costa RicaCote d'IvoireCroatiaCubaCyprusCzech RepublicDenmarkDjiboutiDominicaDominican RepublicEarly-demographic dividendEast Asia & PacificEast Asia & Pacific (excluding high income)East Asia & Pacific (IDA & IBRD countries)EcuadorEgypt, Arab Rep.El SalvadorEquatorial GuineaEritreaEstoniaEthiopiaEuro areaEurope & Central AsiaEurope & Central Asia (excluding high income)Europe & Central Asia (IDA & IBRD countries)European UnionFaroe IslandsFijiFinlandFragile and conflict affected situationsFranceGabonGambia, TheGeorgiaGermanyGhanaGreeceGrenadaGuatemalaGuineaGuinea-BissauGuyanaHaitiHeavily indebted poor countries (HIPC)High incomeHondurasHong Kong SAR, ChinaHungaryIBRD onlyIcelandIDA & IBRD totalIDA blendIDA onlyIDA totalIndiaIndonesiaIran, Islamic Rep.IraqIrelandIsraelItalyJamaicaJapanJordanKazakhstanKenyaKiribatiKorea, Rep.KosovoKuwaitKyrgyz RepublicLao PDRLate-demographic dividendLatin America & Caribbean Latin America & Caribbean (excluding high income)Latin America & the Caribbean (IDA & IBRD countries)LatviaLeast developed countries: UN classificationLebanonLesothoLiberiaLibyaLithuaniaLow & middle incomeLow incomeLower middle incomeLuxembourgMacao SAR, ChinaMacedonia, FYRMadagascarMalawiMalaysiaMaldivesMaliMaltaMauritaniaMauritiusMexicoMicronesia, Fed. Sts.Middle East & North AfricaMiddle East & North Africa (excluding high income)Middle East & North Africa (IDA & IBRD countries)Middle incomeMoldovaMongoliaMontenegroMoroccoMozambiqueNamibiaNepalNetherlandsNew CaledoniaNew ZealandNicaraguaNigerNigeriaNorth AmericaNorwayOECD membersOmanOther small statesPacific island small statesPakistanPanamaPapua New GuineaParaguayPeruPhilippinesPolandPortugalPost-demographic dividendPre-demographic dividendPuerto RicoQatarRomaniaRussian FederationRwandaSaudi ArabiaSenegalSerbiaSeychellesSierra LeoneSingaporeSlovak RepublicSloveniaSmall statesSolomon IslandsSomaliaSouth AfricaSouth AsiaSouth Asia (IDA & IBRD)South SudanSpainSri LankaSt. Kitts and NevisSt. LuciaSt. Vincent and the GrenadinesSub-Saharan Africa Sub-Saharan Africa (excluding high income)Sub-Saharan Africa (IDA & IBRD countries)SudanSurinameSwazilandSwedenSwitzerlandSyrian Arab RepublicTajikistanTanzaniaThailandTimor-LesteTogoTongaTrinidad and TobagoTunisiaTurkeyTurkmenistanUgandaUkraineUnited Arab EmiratesUnited KingdomUnited StatesUpper middle incomeUruguayUzbekistanVanuatuVenezuela, RBVietnamWest Bank and GazaWorldYemen, Rep.ZambiaZimbabwe Timeline:
This timeline shows a graph from 1961 to 2015 of Panama. No data until 1960. Number of actual observations by date: 55.
Source name:
World Development Indicators
Source organization:
World Bank national accounts data, and OECD National Accounts data files.
Categories, topics:
Economy & Growth
Last updated:
apr 23, 2017
Indicators value changes by year
Maximum:
47.046
jan 1, 2015
At the date of observation
Value
Absolute change
Change from previous value
jan 1, 1961
21.314
+21.314
0.0%
jan 1, 1962
24.919
+3.605
16.91%
jan 1, 1963
25.609
+0.69
2.77%
jan 1, 1964
25.652
+0.043
0.17%
jan 1, 1965
22.235
-3.417
-13.32%
jan 1, 1966
22.938
+0.703
3.16%
jan 1, 1967
28.579
+5.641
24.59%
jan 1, 1968
27.491
-1.088
-3.81%
jan 1, 1969
29.12
+1.629
5.92%
jan 1, 1970
30.736
+1.616
5.55%
jan 1, 1971
34.434
+3.699
12.03%
jan 1, 1972
37.571
+3.137
9.11%
jan 1, 1973
39.358
+1.787
4.76%
jan 1, 1974
41.528
+2.17
5.51%
jan 1, 1975
41.583
+0.055
0.13%
jan 1, 1976
38.125
-3.458
-8.32%
jan 1, 1977
39.124
+0.999
2.62%
jan 1, 1978
29.335
-9.788
-25.02%
jan 1, 1979
32.867
+3.532
12.04%
jan 1, 1980
34.705
+1.838
5.59%
jan 1, 1981
35.311
+0.606
1.75%
jan 1, 1982
35.629
+0.317
0.9%
jan 1, 1983
33.812
-1.816
-5.1%
jan 1, 1984
22.471
-11.341
-33.54%
jan 1, 1985
18.627
-3.844
-17.11%
jan 1, 1986
19.121
+0.494
2.65%
jan 1, 1987
21.652
+2.531
13.24%
jan 1, 1988
23.095
+1.443
6.66%
jan 1, 1989
9.44
-13.654
-59.12%
jan 1, 1990
7.732
-1.709
-18.1%
jan 1, 1991
21.141
+13.409
173.43%
jan 1, 1992
24.107
+2.967
14.03%
jan 1, 1993
29.759
+5.651
23.44%
jan 1, 1994
31.061
+1.303
4.38%
jan 1, 1995
33.683
+2.622
8.44%
jan 1, 1996
38.044
+4.361
12.95%
jan 1, 1997
40.414
+2.37
6.23%
jan 1, 1998
38.813
-1.601
-3.96%
jan 1, 1999
41.137
+2.324
5.99%
jan 1, 2000
38.992
-2.145
-5.21%
jan 1, 2001
36.49
-2.502
-6.42%
jan 1, 2002
26.661
-9.829
-26.94%
jan 1, 2003
23.808
-2.853
-10.7%
jan 1, 2004
28.714
+4.906
20.61%
jan 1, 2005
28.272
-0.442
-1.54%
jan 1, 2006
27.751
-0.521
-1.84%
jan 1, 2007
29.422
+1.672
6.02%
jan 1, 2008
36.472
+7.05
23.96%
jan 1, 2009
41.624
+5.152
14.13%
jan 1, 2010
30.425
-11.198
-26.9%
jan 1, 2011
37.201
+6.775
22.27%
jan 1, 2012
43.495
+6.294
16.92%
jan 1, 2013
44.434
+0.938
2.16%
jan 1, 2014
45.84
+1.407
3.17%
jan 1, 2015
47.046
+1.205
2.63%
Ranking of countries by current statistics by years


Comments: