29
/
en
AIzaSyAYiBZKx7MnpbEhh9jyipgxe19OcubqV5w
April 1, 2024
185219
Madagascar
MDG
true
2
1
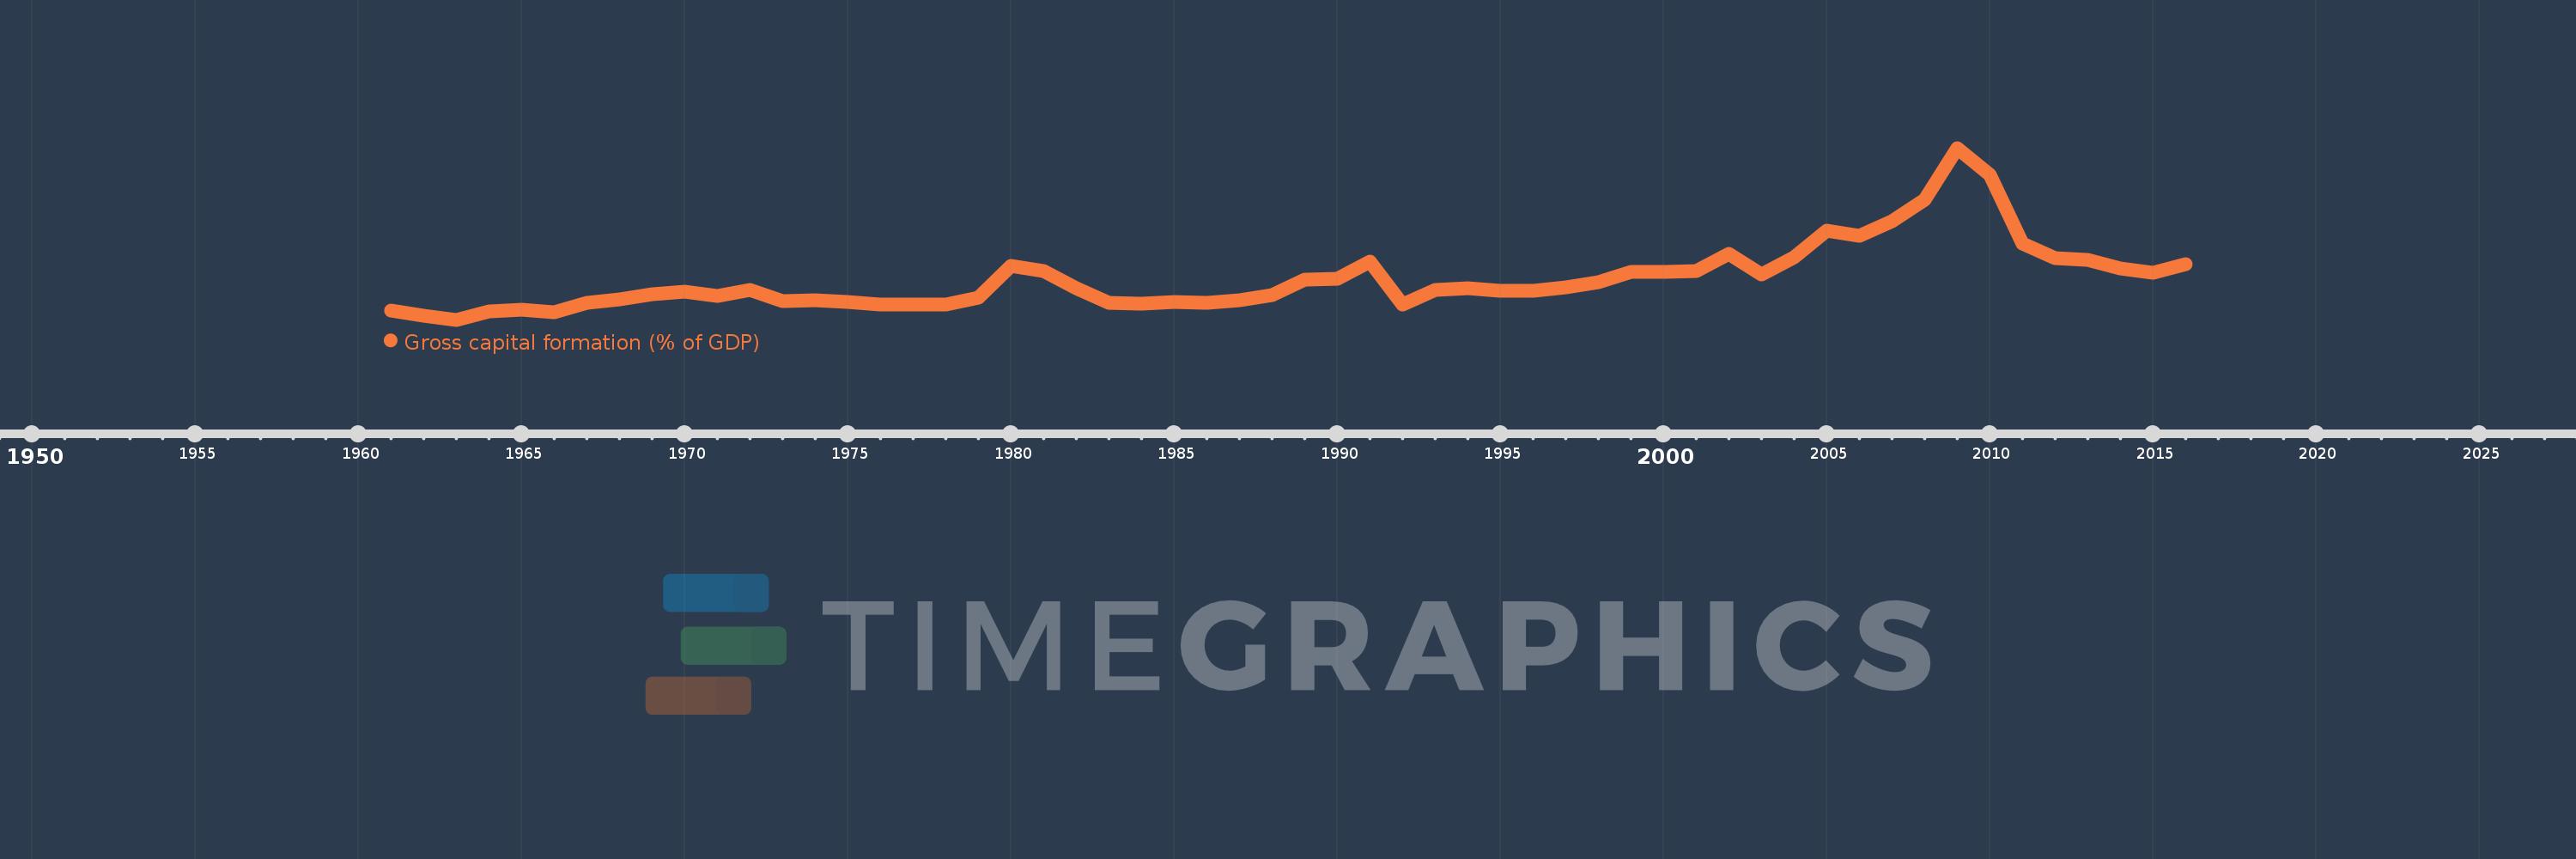
Gross capital formation (% of GDP)
2016,2015,2014,2013,2012,2011,2010,2009,2008,2007,2006,2005,2004,2003,2002,2001,2000,1999,1998,1997,1996,1995,1994,1993,1992,1991,1990,1989,1988,1987,1986,1985,1984,1983,1982,1981,1980,1979,1978,1977,1976,1975,1974,1973,1972,1971,1970,1969,1968,1967,1966,1965,1964,1963,1962,1961
This statistics in other country:
AfghanistanAlbaniaAlgeriaAngolaAntigua and BarbudaArab WorldArgentinaArmeniaArubaAustraliaAustriaAzerbaijanBahamas, TheBahrainBangladeshBarbadosBelarusBelgiumBelizeBeninBermudaBhutanBoliviaBosnia and HerzegovinaBotswanaBrazilBrunei DarussalamBulgariaBurkina FasoBurundiCabo VerdeCambodiaCameroonCanadaCaribbean small statesCentral African RepublicCentral Europe and the BalticsChadChileChinaColombiaComorosCongo, Dem. Rep.Congo, Rep.Costa RicaCote d'IvoireCroatiaCubaCyprusCzech RepublicDenmarkDjiboutiDominicaDominican RepublicEarly-demographic dividendEast Asia & PacificEast Asia & Pacific (excluding high income)East Asia & Pacific (IDA & IBRD countries)EcuadorEgypt, Arab Rep.El SalvadorEquatorial GuineaEritreaEstoniaEthiopiaEuro areaEurope & Central AsiaEurope & Central Asia (excluding high income)Europe & Central Asia (IDA & IBRD countries)European UnionFaroe IslandsFijiFinlandFragile and conflict affected situationsFranceGabonGambia, TheGeorgiaGermanyGhanaGreeceGrenadaGuatemalaGuineaGuinea-BissauGuyanaHaitiHeavily indebted poor countries (HIPC)High incomeHondurasHong Kong SAR, ChinaHungaryIBRD onlyIcelandIDA & IBRD totalIDA blendIDA onlyIDA totalIndiaIndonesiaIran, Islamic Rep.IraqIrelandIsraelItalyJamaicaJapanJordanKazakhstanKenyaKiribatiKorea, Rep.KosovoKuwaitKyrgyz RepublicLao PDRLate-demographic dividendLatin America & Caribbean Latin America & Caribbean (excluding high income)Latin America & the Caribbean (IDA & IBRD countries)LatviaLeast developed countries: UN classificationLebanonLesothoLiberiaLibyaLithuaniaLow & middle incomeLow incomeLower middle incomeLuxembourgMacao SAR, ChinaMacedonia, FYRMadagascarMalawiMalaysiaMaldivesMaliMaltaMauritaniaMauritiusMexicoMicronesia, Fed. Sts.Middle East & North AfricaMiddle East & North Africa (excluding high income)Middle East & North Africa (IDA & IBRD countries)Middle incomeMoldovaMongoliaMontenegroMoroccoMozambiqueNamibiaNepalNetherlandsNew CaledoniaNew ZealandNicaraguaNigerNigeriaNorth AmericaNorwayOECD membersOmanOther small statesPacific island small statesPakistanPanamaPapua New GuineaParaguayPeruPhilippinesPolandPortugalPost-demographic dividendPre-demographic dividendPuerto RicoQatarRomaniaRussian FederationRwandaSaudi ArabiaSenegalSerbiaSeychellesSierra LeoneSingaporeSlovak RepublicSloveniaSmall statesSolomon IslandsSomaliaSouth AfricaSouth AsiaSouth Asia (IDA & IBRD)South SudanSpainSri LankaSt. Kitts and NevisSt. LuciaSt. Vincent and the GrenadinesSub-Saharan Africa Sub-Saharan Africa (excluding high income)Sub-Saharan Africa (IDA & IBRD countries)SudanSurinameSwazilandSwedenSwitzerlandSyrian Arab RepublicTajikistanTanzaniaThailandTimor-LesteTogoTongaTrinidad and TobagoTunisiaTurkeyTurkmenistanUgandaUkraineUnited Arab EmiratesUnited KingdomUnited StatesUpper middle incomeUruguayUzbekistanVanuatuVenezuela, RBVietnamWest Bank and GazaWorldYemen, Rep.ZambiaZimbabwe Timeline:
This timeline shows a graph from 1961 to 2016 of Madagascar. No data until 1960. Number of actual observations by date: 56.
Source name:
World Development Indicators
Source organization:
World Bank national accounts data, and OECD National Accounts data files.
Categories, topics:
Economy & Growth
Last updated:
apr 23, 2017
Indicators value changes by year
Maximum:
40.318
jan 1, 2009
At the date of observation
Value
Absolute change
Change from previous value
jan 1, 1961
6.961
+6.961
0.0%
jan 1, 1962
5.836
-1.126
-16.17%
jan 1, 1963
5.044
-0.791
-13.56%
jan 1, 1964
6.758
+1.714
33.97%
jan 1, 1965
7.07
+0.312
4.62%
jan 1, 1966
6.501
-0.57
-8.06%
jan 1, 1967
8.533
+2.032
31.26%
jan 1, 1968
9.265
+0.732
8.58%
jan 1, 1969
10.319
+1.055
11.38%
jan 1, 1970
10.783
+0.464
4.5%
jan 1, 1971
9.913
-0.871
-8.07%
jan 1, 1972
11.219
+1.307
13.18%
jan 1, 1973
8.82
-2.4
-21.39%
jan 1, 1974
9.097
+0.278
3.15%
jan 1, 1975
8.66
-0.437
-4.81%
jan 1, 1976
8.137
-0.523
-6.04%
jan 1, 1977
8.135
-0.002
-0.03%
jan 1, 1978
8.078
-0.056
-0.69%
jan 1, 1979
9.587
+1.508
18.67%
jan 1, 1980
16.094
+6.507
67.88%
jan 1, 1981
14.962
-1.132
-7.03%
jan 1, 1982
11.478
-3.484
-23.29%
jan 1, 1983
8.486
-2.993
-26.07%
jan 1, 1984
8.365
-0.121
-1.42%
jan 1, 1985
8.619
+0.254
3.04%
jan 1, 1986
8.546
-0.073
-0.85%
jan 1, 1987
9.039
+0.493
5.77%
jan 1, 1988
10.107
+1.067
11.8%
jan 1, 1989
13.294
+3.188
31.54%
jan 1, 1990
13.389
+0.095
0.72%
jan 1, 1991
16.972
+3.582
26.76%
jan 1, 1992
8.243
-8.729
-51.43%
jan 1, 1993
11.209
+2.965
35.97%
jan 1, 1994
11.448
+0.239
2.13%
jan 1, 1995
10.903
-0.544
-4.76%
jan 1, 1996
10.942
+0.039
0.36%
jan 1, 1997
11.637
+0.695
6.35%
jan 1, 1998
12.814
+1.177
10.11%
jan 1, 1999
14.781
+1.967
15.35%
jan 1, 2000
14.92
+0.139
0.94%
jan 1, 2001
15.045
+0.125
0.83%
jan 1, 2002
18.5
+3.455
22.96%
jan 1, 2003
14.263
-4.237
-22.9%
jan 1, 2004
17.893
+3.63
25.45%
jan 1, 2005
23.379
+5.486
30.66%
jan 1, 2006
22.195
-1.184
-5.06%
jan 1, 2007
25.291
+3.096
13.95%
jan 1, 2008
29.608
+4.317
17.07%
jan 1, 2009
40.318
+10.71
36.17%
jan 1, 2010
34.764
-5.554
-13.77%
jan 1, 2011
20.775
-13.989
-40.24%
jan 1, 2012
17.609
-3.166
-15.24%
jan 1, 2013
17.334
-0.275
-1.56%
jan 1, 2014
15.601
-1.733
-10.0%
jan 1, 2015
14.673
-0.928
-5.95%
jan 1, 2016
16.531
+1.859
12.67%
Ranking of countries by current statistics by years


Comments: