29
/
en
AIzaSyAYiBZKx7MnpbEhh9jyipgxe19OcubqV5w
April 1, 2024
59816
Sub-Saharan Africa (excluding high income)
SSA
false
2
1
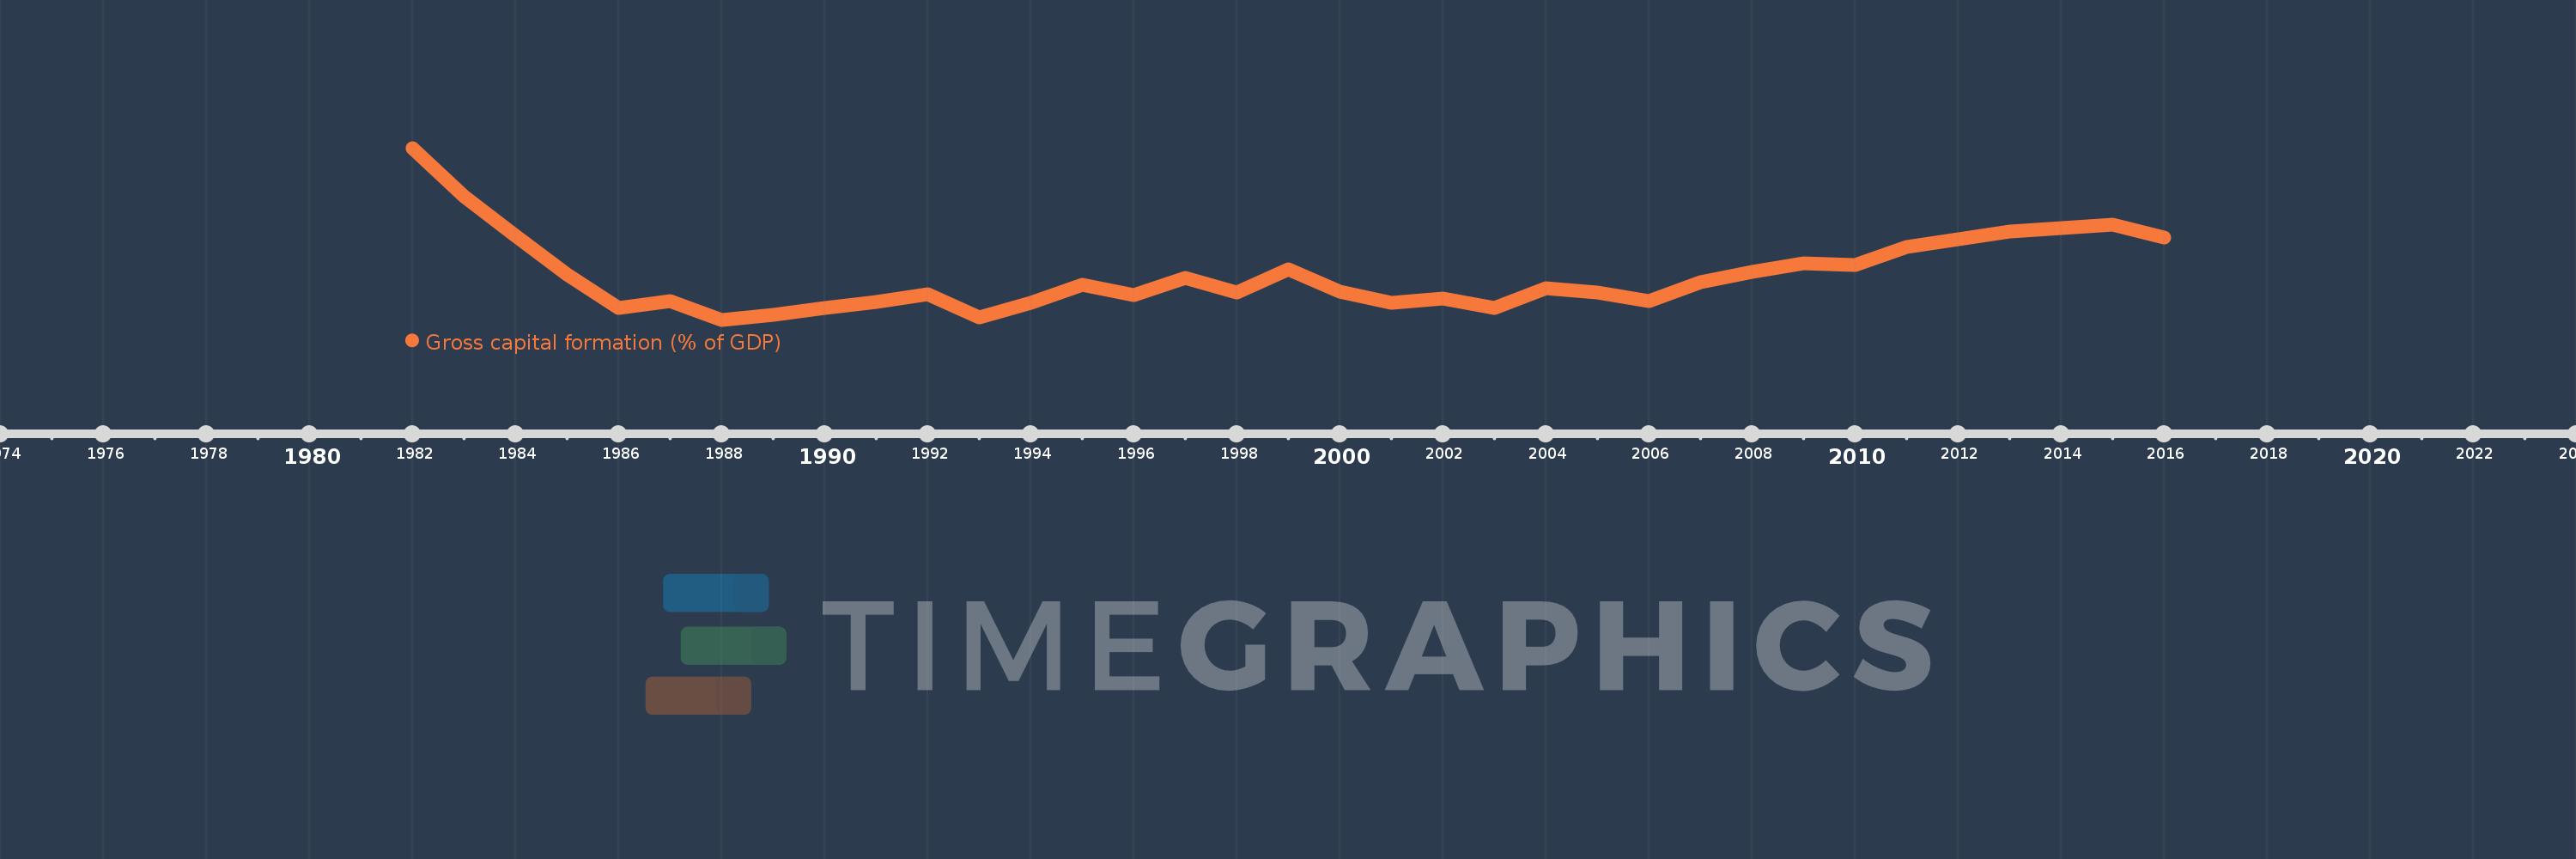
Gross capital formation (% of GDP)
2016,2015,2014,2013,2012,2011,2010,2009,2008,2007,2006,2005,2004,2003,2002,2001,2000,1999,1998,1997,1996,1995,1994,1993,1992,1991,1990,1989,1988,1987,1986,1985,1984,1983,1982
This statistics in other country:
AfghanistanAlbaniaAlgeriaAngolaAntigua and BarbudaArab WorldArgentinaArmeniaArubaAustraliaAustriaAzerbaijanBahamas, TheBahrainBangladeshBarbadosBelarusBelgiumBelizeBeninBermudaBhutanBoliviaBosnia and HerzegovinaBotswanaBrazilBrunei DarussalamBulgariaBurkina FasoBurundiCabo VerdeCambodiaCameroonCanadaCaribbean small statesCentral African RepublicCentral Europe and the BalticsChadChileChinaColombiaComorosCongo, Dem. Rep.Congo, Rep.Costa RicaCote d'IvoireCroatiaCubaCyprusCzech RepublicDenmarkDjiboutiDominicaDominican RepublicEarly-demographic dividendEast Asia & PacificEast Asia & Pacific (excluding high income)East Asia & Pacific (IDA & IBRD countries)EcuadorEgypt, Arab Rep.El SalvadorEquatorial GuineaEritreaEstoniaEthiopiaEuro areaEurope & Central AsiaEurope & Central Asia (excluding high income)Europe & Central Asia (IDA & IBRD countries)European UnionFaroe IslandsFijiFinlandFragile and conflict affected situationsFranceGabonGambia, TheGeorgiaGermanyGhanaGreeceGrenadaGuatemalaGuineaGuinea-BissauGuyanaHaitiHeavily indebted poor countries (HIPC)High incomeHondurasHong Kong SAR, ChinaHungaryIBRD onlyIcelandIDA & IBRD totalIDA blendIDA onlyIDA totalIndiaIndonesiaIran, Islamic Rep.IraqIrelandIsraelItalyJamaicaJapanJordanKazakhstanKenyaKiribatiKorea, Rep.KosovoKuwaitKyrgyz RepublicLao PDRLate-demographic dividendLatin America & Caribbean Latin America & Caribbean (excluding high income)Latin America & the Caribbean (IDA & IBRD countries)LatviaLeast developed countries: UN classificationLebanonLesothoLiberiaLibyaLithuaniaLow & middle incomeLow incomeLower middle incomeLuxembourgMacao SAR, ChinaMacedonia, FYRMadagascarMalawiMalaysiaMaldivesMaliMaltaMauritaniaMauritiusMexicoMicronesia, Fed. Sts.Middle East & North AfricaMiddle East & North Africa (excluding high income)Middle East & North Africa (IDA & IBRD countries)Middle incomeMoldovaMongoliaMontenegroMoroccoMozambiqueNamibiaNepalNetherlandsNew CaledoniaNew ZealandNicaraguaNigerNigeriaNorth AmericaNorwayOECD membersOmanOther small statesPacific island small statesPakistanPanamaPapua New GuineaParaguayPeruPhilippinesPolandPortugalPost-demographic dividendPre-demographic dividendPuerto RicoQatarRomaniaRussian FederationRwandaSaudi ArabiaSenegalSerbiaSeychellesSierra LeoneSingaporeSlovak RepublicSloveniaSmall statesSolomon IslandsSomaliaSouth AfricaSouth AsiaSouth Asia (IDA & IBRD)South SudanSpainSri LankaSt. Kitts and NevisSt. LuciaSt. Vincent and the GrenadinesSub-Saharan Africa Sub-Saharan Africa (excluding high income)Sub-Saharan Africa (IDA & IBRD countries)SudanSurinameSwazilandSwedenSwitzerlandSyrian Arab RepublicTajikistanTanzaniaThailandTimor-LesteTogoTongaTrinidad and TobagoTunisiaTurkeyTurkmenistanUgandaUkraineUnited Arab EmiratesUnited KingdomUnited StatesUpper middle incomeUruguayUzbekistanVanuatuVenezuela, RBVietnamWest Bank and GazaWorldYemen, Rep.ZambiaZimbabwe Timeline:
This timeline shows a graph from 1982 to 2016 of Sub-Saharan Africa (excluding high income). No data until 1981. Number of actual observations by date: 35.
Source name:
World Development Indicators
Source organization:
World Bank national accounts data, and OECD National Accounts data files.
Categories, topics:
Economy & Growth
Last updated:
apr 23, 2017
Indicators value changes by year
Minimum:
14.069
jan 1, 1988
Maximum:
27.602
jan 1, 1982
At the date of observation
Value
Absolute change
Change from previous value
jan 1, 1982
27.602
+27.602
0.0%
jan 1, 1983
23.824
-3.778
-13.69%
jan 1, 1984
20.685
-3.138
-13.17%
jan 1, 1985
17.642
-3.044
-14.72%
jan 1, 1986
14.972
-2.669
-15.13%
jan 1, 1987
15.57
+0.597
3.99%
jan 1, 1988
14.069
-1.501
-9.64%
jan 1, 1989
14.464
+0.395
2.81%
jan 1, 1990
14.982
+0.518
3.58%
jan 1, 1991
15.498
+0.516
3.45%
jan 1, 1992
16.072
+0.574
3.7%
jan 1, 1993
14.265
-1.807
-11.24%
jan 1, 1994
15.394
+1.129
7.91%
jan 1, 1995
16.817
+1.423
9.24%
jan 1, 1996
16.028
-0.788
-4.69%
jan 1, 1997
17.34
+1.311
8.18%
jan 1, 1998
16.242
-1.098
-6.33%
jan 1, 1999
18.057
+1.816
11.18%
jan 1, 2000
16.269
-1.788
-9.9%
jan 1, 2001
15.401
-0.868
-5.33%
jan 1, 2002
15.715
+0.314
2.04%
jan 1, 2003
14.979
-0.736
-4.68%
jan 1, 2004
16.562
+1.583
10.57%
jan 1, 2005
16.19
-0.371
-2.24%
jan 1, 2006
15.55
-0.64
-3.96%
jan 1, 2007
17.003
+1.453
9.34%
jan 1, 2008
17.871
+0.869
5.11%
jan 1, 2009
18.524
+0.653
3.65%
jan 1, 2010
18.409
-0.115
-0.62%
jan 1, 2011
19.772
+1.362
7.4%
jan 1, 2012
20.419
+0.647
3.27%
jan 1, 2013
21.019
+0.601
2.94%
jan 1, 2014
21.26
+0.241
1.15%
jan 1, 2015
21.577
+0.316
1.49%
jan 1, 2016
20.527
-1.05
-4.87%
Ranking of countries by current statistics by years


Comments: