29
/
en
AIzaSyAYiBZKx7MnpbEhh9jyipgxe19OcubqV5w
April 1, 2024
124841
Egypt, Arab Rep.
EGY
true
2
1
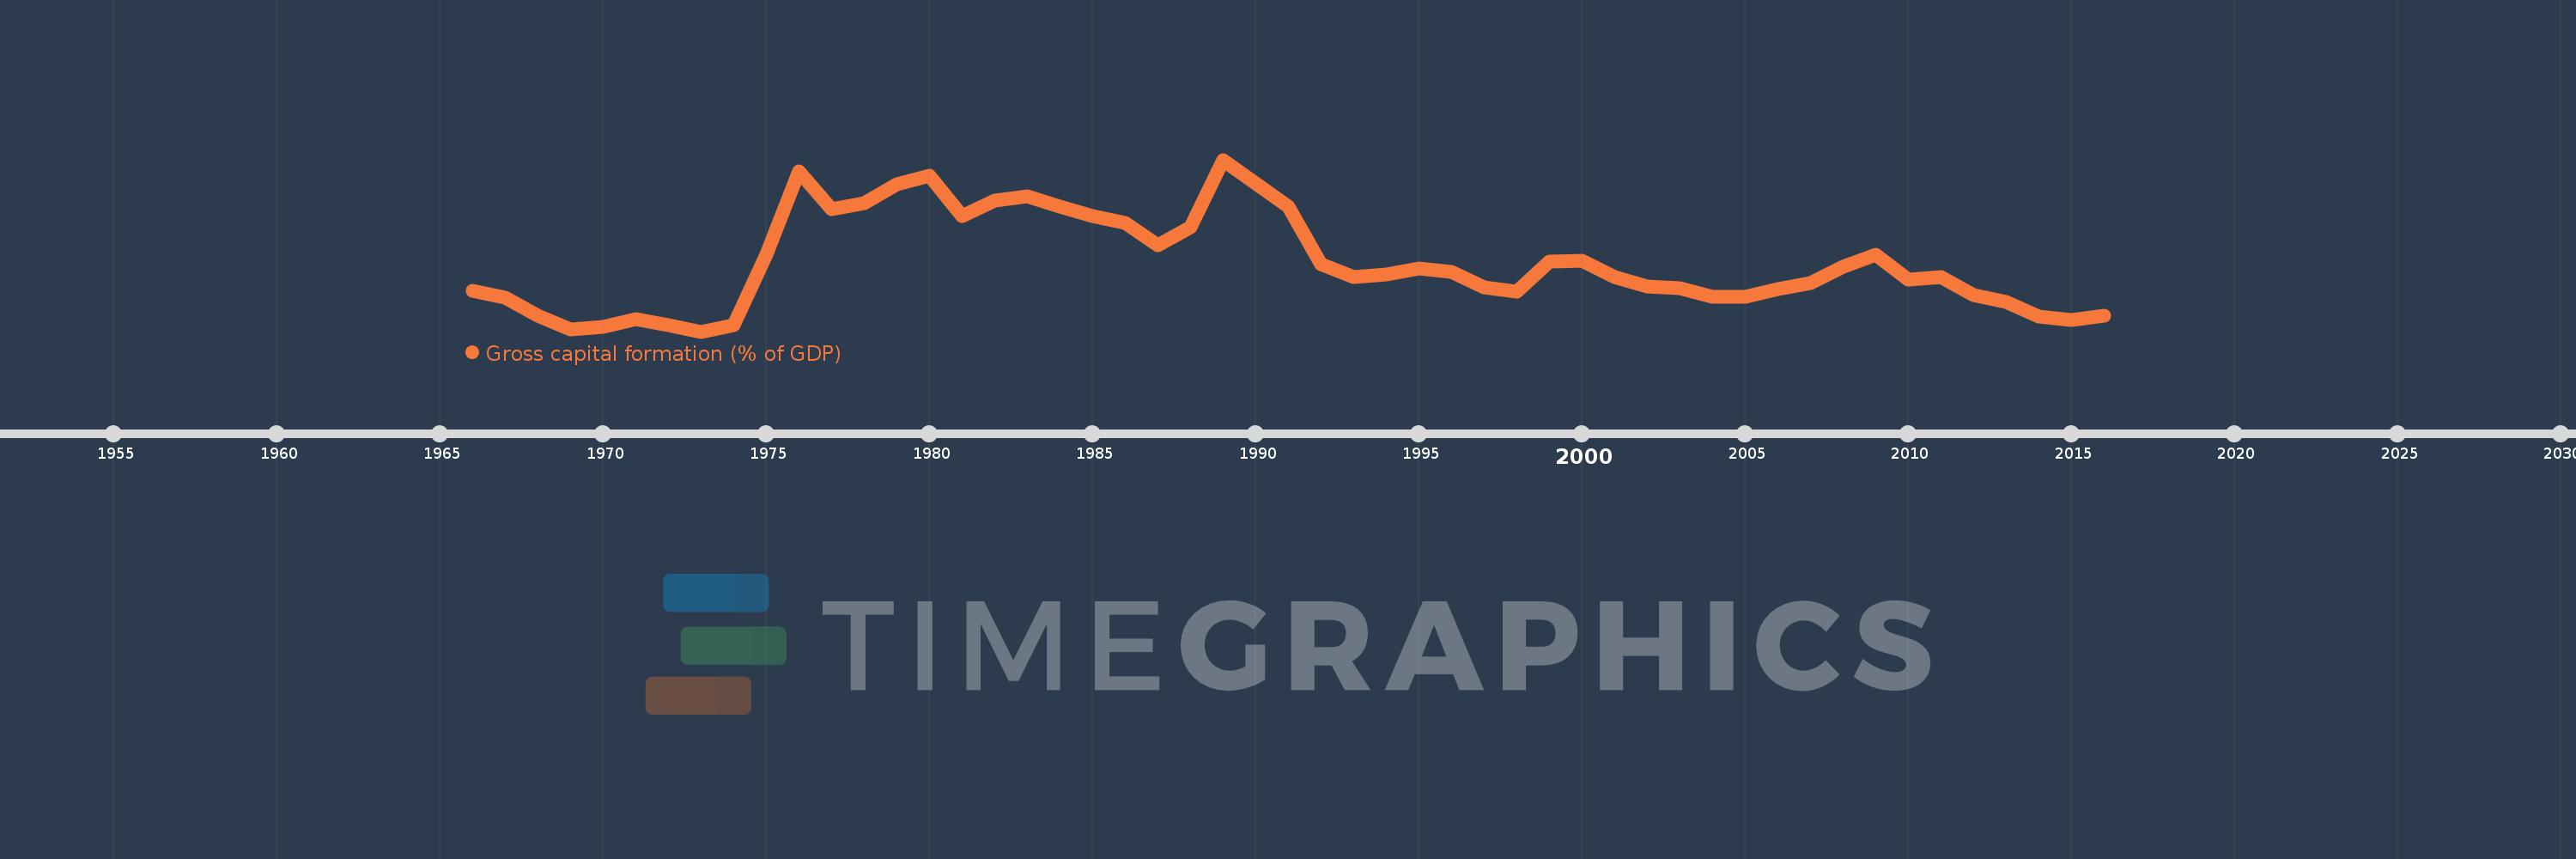
Gross capital formation (% of GDP)
2016,2015,2014,2013,2012,2011,2010,2009,2008,2007,2006,2005,2004,2003,2002,2001,2000,1999,1998,1997,1996,1995,1994,1993,1992,1991,1990,1989,1988,1987,1986,1985,1984,1983,1982,1981,1980,1979,1978,1977,1976,1975,1974,1973,1972,1971,1970,1969,1968,1967,1966
This statistics in other country:
AfghanistanAlbaniaAlgeriaAngolaAntigua and BarbudaArab WorldArgentinaArmeniaArubaAustraliaAustriaAzerbaijanBahamas, TheBahrainBangladeshBarbadosBelarusBelgiumBelizeBeninBermudaBhutanBoliviaBosnia and HerzegovinaBotswanaBrazilBrunei DarussalamBulgariaBurkina FasoBurundiCabo VerdeCambodiaCameroonCanadaCaribbean small statesCentral African RepublicCentral Europe and the BalticsChadChileChinaColombiaComorosCongo, Dem. Rep.Congo, Rep.Costa RicaCote d'IvoireCroatiaCubaCyprusCzech RepublicDenmarkDjiboutiDominicaDominican RepublicEarly-demographic dividendEast Asia & PacificEast Asia & Pacific (excluding high income)East Asia & Pacific (IDA & IBRD countries)EcuadorEgypt, Arab Rep.El SalvadorEquatorial GuineaEritreaEstoniaEthiopiaEuro areaEurope & Central AsiaEurope & Central Asia (excluding high income)Europe & Central Asia (IDA & IBRD countries)European UnionFaroe IslandsFijiFinlandFragile and conflict affected situationsFranceGabonGambia, TheGeorgiaGermanyGhanaGreeceGrenadaGuatemalaGuineaGuinea-BissauGuyanaHaitiHeavily indebted poor countries (HIPC)High incomeHondurasHong Kong SAR, ChinaHungaryIBRD onlyIcelandIDA & IBRD totalIDA blendIDA onlyIDA totalIndiaIndonesiaIran, Islamic Rep.IraqIrelandIsraelItalyJamaicaJapanJordanKazakhstanKenyaKiribatiKorea, Rep.KosovoKuwaitKyrgyz RepublicLao PDRLate-demographic dividendLatin America & Caribbean Latin America & Caribbean (excluding high income)Latin America & the Caribbean (IDA & IBRD countries)LatviaLeast developed countries: UN classificationLebanonLesothoLiberiaLibyaLithuaniaLow & middle incomeLow incomeLower middle incomeLuxembourgMacao SAR, ChinaMacedonia, FYRMadagascarMalawiMalaysiaMaldivesMaliMaltaMauritaniaMauritiusMexicoMicronesia, Fed. Sts.Middle East & North AfricaMiddle East & North Africa (excluding high income)Middle East & North Africa (IDA & IBRD countries)Middle incomeMoldovaMongoliaMontenegroMoroccoMozambiqueNamibiaNepalNetherlandsNew CaledoniaNew ZealandNicaraguaNigerNigeriaNorth AmericaNorwayOECD membersOmanOther small statesPacific island small statesPakistanPanamaPapua New GuineaParaguayPeruPhilippinesPolandPortugalPost-demographic dividendPre-demographic dividendPuerto RicoQatarRomaniaRussian FederationRwandaSaudi ArabiaSenegalSerbiaSeychellesSierra LeoneSingaporeSlovak RepublicSloveniaSmall statesSolomon IslandsSomaliaSouth AfricaSouth AsiaSouth Asia (IDA & IBRD)South SudanSpainSri LankaSt. Kitts and NevisSt. LuciaSt. Vincent and the GrenadinesSub-Saharan Africa Sub-Saharan Africa (excluding high income)Sub-Saharan Africa (IDA & IBRD countries)SudanSurinameSwazilandSwedenSwitzerlandSyrian Arab RepublicTajikistanTanzaniaThailandTimor-LesteTogoTongaTrinidad and TobagoTunisiaTurkeyTurkmenistanUgandaUkraineUnited Arab EmiratesUnited KingdomUnited StatesUpper middle incomeUruguayUzbekistanVanuatuVenezuela, RBVietnamWest Bank and GazaWorldYemen, Rep.ZambiaZimbabwe Timeline:
This timeline shows a graph from 1966 to 2016 of Egypt, Arab Rep.. No data until 1965. Number of actual observations by date: 51.
Source name:
World Development Indicators
Source organization:
World Bank national accounts data, and OECD National Accounts data files.
Categories, topics:
Economy & Growth
Last updated:
apr 23, 2017
Indicators value changes by year
Maximum:
34.919
jan 1, 1989
At the date of observation
Value
Absolute change
Change from previous value
jan 1, 1966
17.692
+17.692
0.0%
jan 1, 1967
16.812
-0.879
-4.97%
jan 1, 1968
14.424
-2.388
-14.21%
jan 1, 1969
12.629
-1.795
-12.45%
jan 1, 1970
12.957
+0.329
2.6%
jan 1, 1971
13.948
+0.991
7.65%
jan 1, 1972
13.227
-0.721
-5.17%
jan 1, 1973
12.34
-0.887
-6.71%
jan 1, 1974
13.147
+0.807
6.54%
jan 1, 1975
22.471
+9.324
70.92%
jan 1, 1976
33.365
+10.895
48.48%
jan 1, 1977
28.393
-4.972
-14.9%
jan 1, 1978
29.171
+0.778
2.74%
jan 1, 1979
31.659
+2.488
8.53%
jan 1, 1980
32.845
+1.186
3.75%
jan 1, 1981
27.514
-5.331
-16.23%
jan 1, 1982
29.509
+1.995
7.25%
jan 1, 1983
30.076
+0.566
1.92%
jan 1, 1984
28.73
-1.346
-4.47%
jan 1, 1985
27.484
-1.246
-4.34%
jan 1, 1986
26.675
-0.809
-2.94%
jan 1, 1987
23.707
-2.968
-11.13%
jan 1, 1988
26.083
+2.376
10.02%
jan 1, 1989
34.919
+8.837
33.88%
jan 1, 1990
31.775
-3.145
-9.01%
jan 1, 1991
28.813
-2.962
-9.32%
jan 1, 1992
21.17
-7.643
-26.53%
jan 1, 1993
19.482
-1.687
-7.97%
jan 1, 1994
19.845
+0.363
1.86%
jan 1, 1995
20.629
+0.783
3.95%
jan 1, 1996
20.147
-0.482
-2.33%
jan 1, 1997
18.134
-2.013
-9.99%
jan 1, 1998
17.563
-0.571
-3.15%
jan 1, 1999
21.503
+3.94
22.43%
jan 1, 2000
21.619
+0.116
0.54%
jan 1, 2001
19.553
-2.066
-9.56%
jan 1, 2002
18.26
-1.293
-6.61%
jan 1, 2003
17.999
-0.261
-1.43%
jan 1, 2004
16.886
-1.113
-6.18%
jan 1, 2005
16.938
+0.052
0.31%
jan 1, 2006
17.976
+1.038
6.13%
jan 1, 2007
18.731
+0.755
4.2%
jan 1, 2008
20.851
+2.12
11.32%
jan 1, 2009
22.39
+1.538
7.38%
jan 1, 2010
19.19
-3.2
-14.29%
jan 1, 2011
19.501
+0.311
1.62%
jan 1, 2012
17.103
-2.398
-12.3%
jan 1, 2013
16.202
-0.901
-5.27%
jan 1, 2014
14.34
-1.862
-11.49%
jan 1, 2015
13.826
-0.514
-3.59%
jan 1, 2016
14.373
+0.547
3.96%
Ranking of countries by current statistics by years


Comments: