29
/
en
AIzaSyAYiBZKx7MnpbEhh9jyipgxe19OcubqV5w
April 1, 2024
123534
Ecuador
ECU
true
2
1
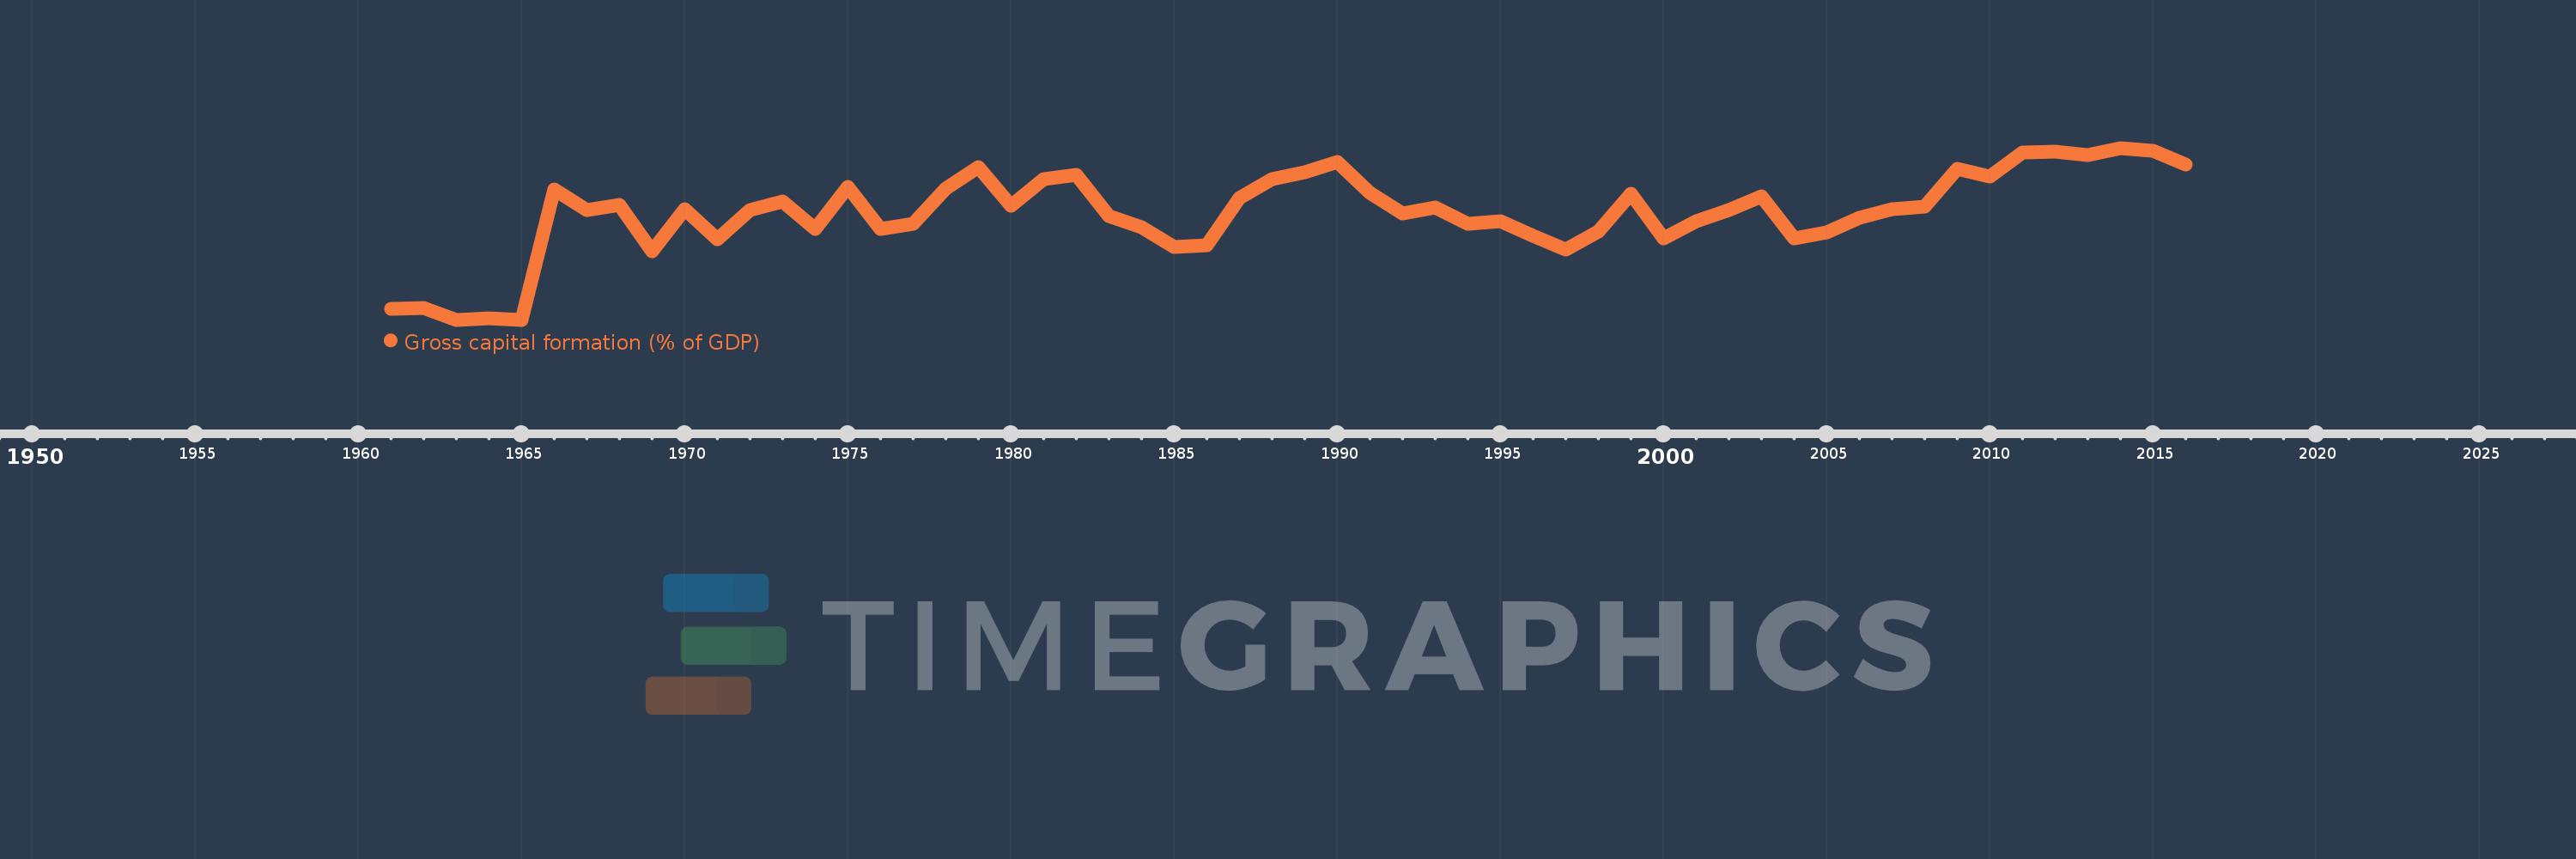
Gross capital formation (% of GDP)
2016,2015,2014,2013,2012,2011,2010,2009,2008,2007,2006,2005,2004,2003,2002,2001,2000,1999,1998,1997,1996,1995,1994,1993,1992,1991,1990,1989,1988,1987,1986,1985,1984,1983,1982,1981,1980,1979,1978,1977,1976,1975,1974,1973,1972,1971,1970,1969,1968,1967,1966,1965,1964,1963,1962,1961
This statistics in other country:
AfghanistanAlbaniaAlgeriaAngolaAntigua and BarbudaArab WorldArgentinaArmeniaArubaAustraliaAustriaAzerbaijanBahamas, TheBahrainBangladeshBarbadosBelarusBelgiumBelizeBeninBermudaBhutanBoliviaBosnia and HerzegovinaBotswanaBrazilBrunei DarussalamBulgariaBurkina FasoBurundiCabo VerdeCambodiaCameroonCanadaCaribbean small statesCentral African RepublicCentral Europe and the BalticsChadChileChinaColombiaComorosCongo, Dem. Rep.Congo, Rep.Costa RicaCote d'IvoireCroatiaCubaCyprusCzech RepublicDenmarkDjiboutiDominicaDominican RepublicEarly-demographic dividendEast Asia & PacificEast Asia & Pacific (excluding high income)East Asia & Pacific (IDA & IBRD countries)EcuadorEgypt, Arab Rep.El SalvadorEquatorial GuineaEritreaEstoniaEthiopiaEuro areaEurope & Central AsiaEurope & Central Asia (excluding high income)Europe & Central Asia (IDA & IBRD countries)European UnionFaroe IslandsFijiFinlandFragile and conflict affected situationsFranceGabonGambia, TheGeorgiaGermanyGhanaGreeceGrenadaGuatemalaGuineaGuinea-BissauGuyanaHaitiHeavily indebted poor countries (HIPC)High incomeHondurasHong Kong SAR, ChinaHungaryIBRD onlyIcelandIDA & IBRD totalIDA blendIDA onlyIDA totalIndiaIndonesiaIran, Islamic Rep.IraqIrelandIsraelItalyJamaicaJapanJordanKazakhstanKenyaKiribatiKorea, Rep.KosovoKuwaitKyrgyz RepublicLao PDRLate-demographic dividendLatin America & Caribbean Latin America & Caribbean (excluding high income)Latin America & the Caribbean (IDA & IBRD countries)LatviaLeast developed countries: UN classificationLebanonLesothoLiberiaLibyaLithuaniaLow & middle incomeLow incomeLower middle incomeLuxembourgMacao SAR, ChinaMacedonia, FYRMadagascarMalawiMalaysiaMaldivesMaliMaltaMauritaniaMauritiusMexicoMicronesia, Fed. Sts.Middle East & North AfricaMiddle East & North Africa (excluding high income)Middle East & North Africa (IDA & IBRD countries)Middle incomeMoldovaMongoliaMontenegroMoroccoMozambiqueNamibiaNepalNetherlandsNew CaledoniaNew ZealandNicaraguaNigerNigeriaNorth AmericaNorwayOECD membersOmanOther small statesPacific island small statesPakistanPanamaPapua New GuineaParaguayPeruPhilippinesPolandPortugalPost-demographic dividendPre-demographic dividendPuerto RicoQatarRomaniaRussian FederationRwandaSaudi ArabiaSenegalSerbiaSeychellesSierra LeoneSingaporeSlovak RepublicSloveniaSmall statesSolomon IslandsSomaliaSouth AfricaSouth AsiaSouth Asia (IDA & IBRD)South SudanSpainSri LankaSt. Kitts and NevisSt. LuciaSt. Vincent and the GrenadinesSub-Saharan Africa Sub-Saharan Africa (excluding high income)Sub-Saharan Africa (IDA & IBRD countries)SudanSurinameSwazilandSwedenSwitzerlandSyrian Arab RepublicTajikistanTanzaniaThailandTimor-LesteTogoTongaTrinidad and TobagoTunisiaTurkeyTurkmenistanUgandaUkraineUnited Arab EmiratesUnited KingdomUnited StatesUpper middle incomeUruguayUzbekistanVanuatuVenezuela, RBVietnamWest Bank and GazaWorldYemen, Rep.ZambiaZimbabwe Timeline:
This timeline shows a graph from 1961 to 2016 of Ecuador. No data until 1960. Number of actual observations by date: 56.
Source name:
World Development Indicators
Source organization:
World Bank national accounts data, and OECD National Accounts data files.
Categories, topics:
Economy & Growth
Last updated:
apr 23, 2017
Indicators value changes by year
Maximum:
28.467
jan 1, 2014
At the date of observation
Value
Absolute change
Change from previous value
jan 1, 1961
12.729
+12.729
0.0%
jan 1, 1962
12.829
+0.1
0.79%
jan 1, 1963
11.647
-1.181
-9.21%
jan 1, 1964
11.76
+0.113
0.97%
jan 1, 1965
11.64
-0.12
-1.02%
jan 1, 1966
24.365
+12.724
109.31%
jan 1, 1967
22.382
-1.982
-8.14%
jan 1, 1968
22.904
+0.522
2.33%
jan 1, 1969
18.358
-4.546
-19.85%
jan 1, 1970
22.484
+4.126
22.48%
jan 1, 1971
19.56
-2.924
-13.01%
jan 1, 1972
22.399
+2.839
14.51%
jan 1, 1973
23.254
+0.855
3.82%
jan 1, 1974
20.525
-2.728
-11.73%
jan 1, 1975
24.643
+4.118
20.06%
jan 1, 1976
20.575
-4.068
-16.51%
jan 1, 1977
21.056
+0.481
2.34%
jan 1, 1978
24.49
+3.434
16.31%
jan 1, 1979
26.603
+2.114
8.63%
jan 1, 1980
22.785
-3.818
-14.35%
jan 1, 1981
25.375
+2.59
11.37%
jan 1, 1982
25.826
+0.451
1.78%
jan 1, 1983
21.765
-4.062
-15.73%
jan 1, 1984
20.666
-1.099
-5.05%
jan 1, 1985
18.782
-1.884
-9.12%
jan 1, 1986
18.952
+0.17
0.9%
jan 1, 1987
23.569
+4.617
24.36%
jan 1, 1988
25.408
+1.839
7.8%
jan 1, 1989
26.11
+0.703
2.76%
jan 1, 1990
27.09
+0.98
3.75%
jan 1, 1991
24.072
-3.018
-11.14%
jan 1, 1992
22.045
-2.027
-8.42%
jan 1, 1993
22.67
+0.625
2.83%
jan 1, 1994
21.077
-1.593
-7.03%
jan 1, 1995
21.286
+0.209
0.99%
jan 1, 1996
19.825
-1.462
-6.87%
jan 1, 1997
18.538
-1.287
-6.49%
jan 1, 1998
20.309
+1.771
9.55%
jan 1, 1999
23.996
+3.687
18.15%
jan 1, 2000
19.628
-4.367
-18.2%
jan 1, 2001
21.279
+1.65
8.41%
jan 1, 2002
22.349
+1.07
5.03%
jan 1, 2003
23.702
+1.353
6.05%
jan 1, 2004
19.59
-4.113
-17.35%
jan 1, 2005
20.199
+0.609
3.11%
jan 1, 2006
21.637
+1.438
7.12%
jan 1, 2007
22.46
+0.823
3.8%
jan 1, 2008
22.705
+0.245
1.09%
jan 1, 2009
26.388
+3.683
16.22%
jan 1, 2010
25.639
-0.748
-2.84%
jan 1, 2011
28.037
+2.398
9.35%
jan 1, 2012
28.142
+0.105
0.37%
jan 1, 2013
27.796
-0.347
-1.23%
jan 1, 2014
28.467
+0.671
2.41%
jan 1, 2015
28.187
-0.28
-0.98%
jan 1, 2016
26.854
-1.333
-4.73%
Ranking of countries by current statistics by years


Comments: