29
/
en
AIzaSyAYiBZKx7MnpbEhh9jyipgxe19OcubqV5w
April 1, 2024
279827
Vanuatu
VUT
true
2
1
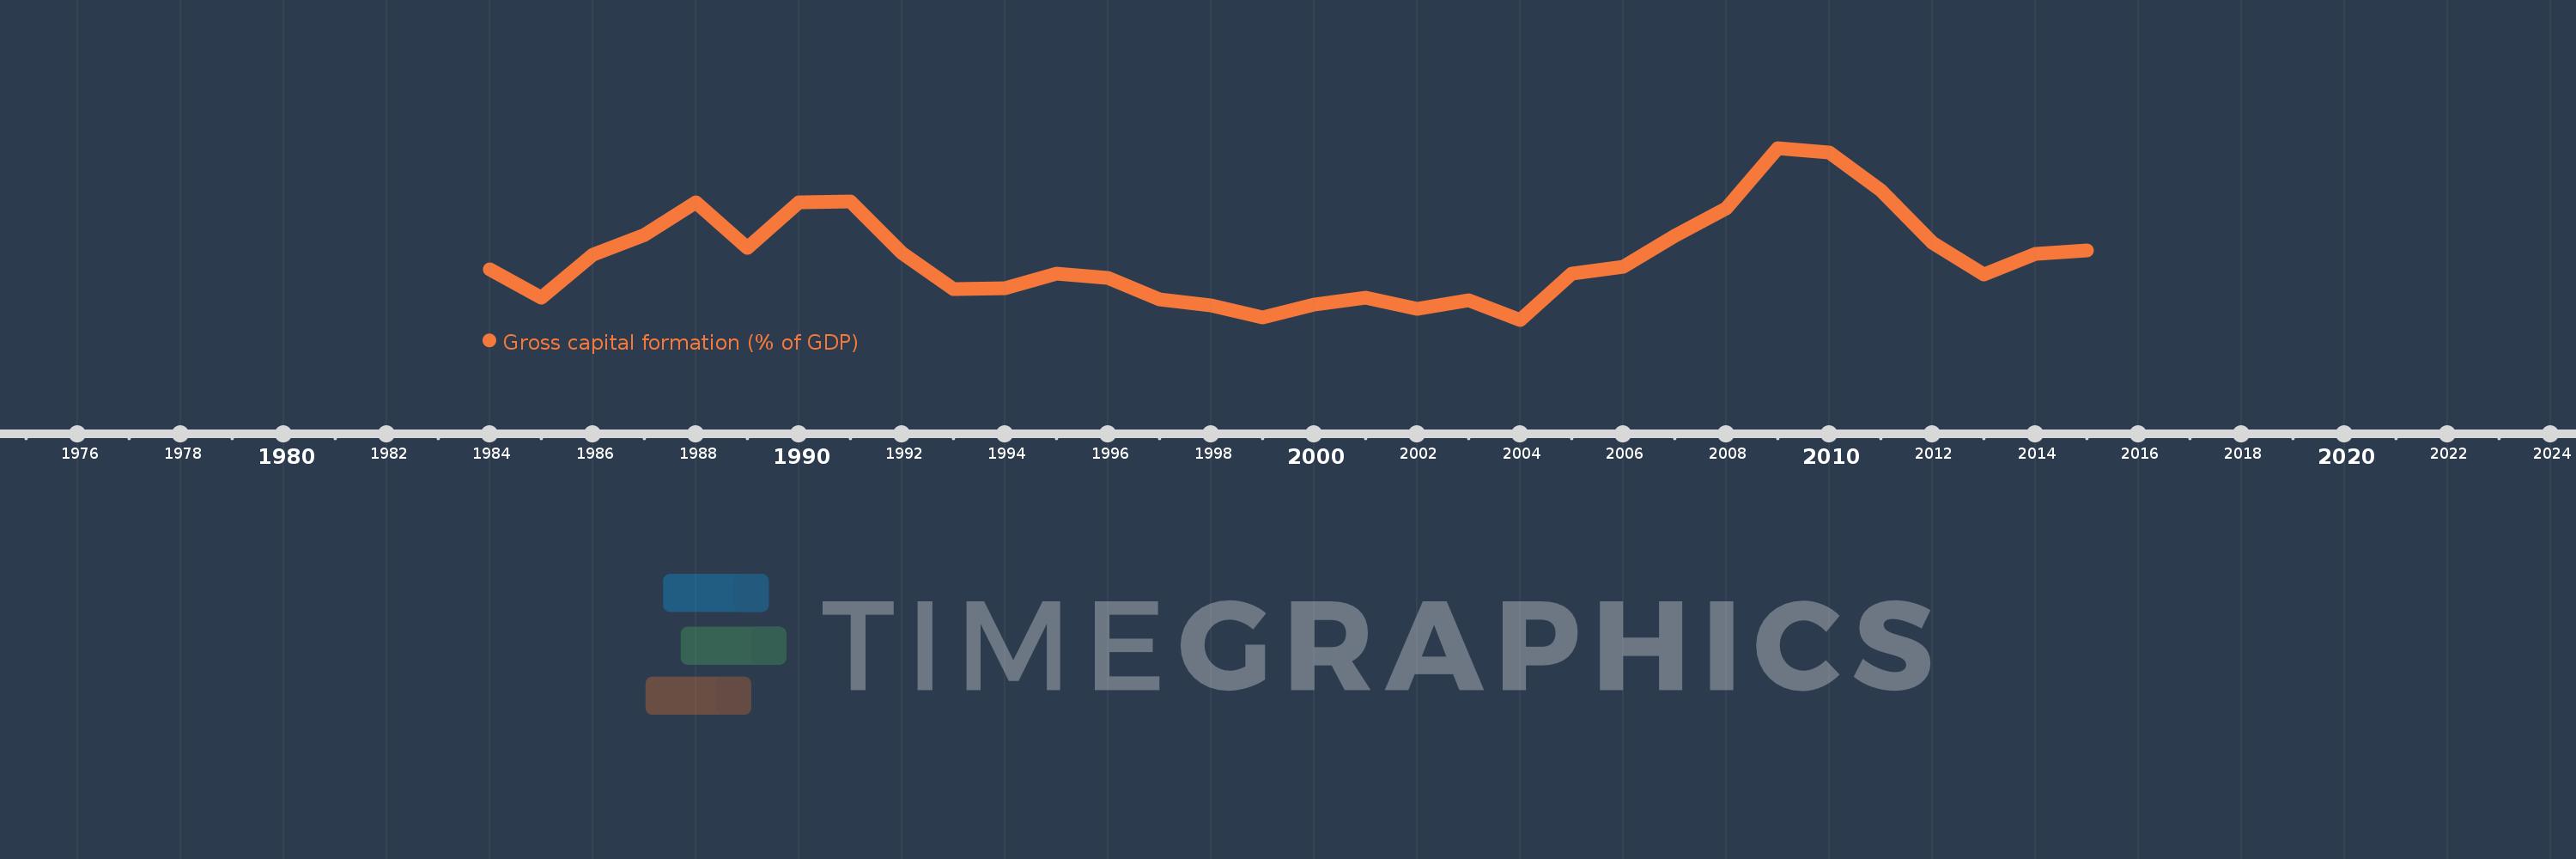
Gross capital formation (% of GDP)
2015,2014,2013,2012,2011,2010,2009,2008,2007,2006,2005,2004,2003,2002,2001,2000,1999,1998,1997,1996,1995,1994,1993,1992,1991,1990,1989,1988,1987,1986,1985,1984
This statistics in other country:
AfghanistanAlbaniaAlgeriaAngolaAntigua and BarbudaArab WorldArgentinaArmeniaArubaAustraliaAustriaAzerbaijanBahamas, TheBahrainBangladeshBarbadosBelarusBelgiumBelizeBeninBermudaBhutanBoliviaBosnia and HerzegovinaBotswanaBrazilBrunei DarussalamBulgariaBurkina FasoBurundiCabo VerdeCambodiaCameroonCanadaCaribbean small statesCentral African RepublicCentral Europe and the BalticsChadChileChinaColombiaComorosCongo, Dem. Rep.Congo, Rep.Costa RicaCote d'IvoireCroatiaCubaCyprusCzech RepublicDenmarkDjiboutiDominicaDominican RepublicEarly-demographic dividendEast Asia & PacificEast Asia & Pacific (excluding high income)East Asia & Pacific (IDA & IBRD countries)EcuadorEgypt, Arab Rep.El SalvadorEquatorial GuineaEritreaEstoniaEthiopiaEuro areaEurope & Central AsiaEurope & Central Asia (excluding high income)Europe & Central Asia (IDA & IBRD countries)European UnionFaroe IslandsFijiFinlandFragile and conflict affected situationsFranceGabonGambia, TheGeorgiaGermanyGhanaGreeceGrenadaGuatemalaGuineaGuinea-BissauGuyanaHaitiHeavily indebted poor countries (HIPC)High incomeHondurasHong Kong SAR, ChinaHungaryIBRD onlyIcelandIDA & IBRD totalIDA blendIDA onlyIDA totalIndiaIndonesiaIran, Islamic Rep.IraqIrelandIsraelItalyJamaicaJapanJordanKazakhstanKenyaKiribatiKorea, Rep.KosovoKuwaitKyrgyz RepublicLao PDRLate-demographic dividendLatin America & Caribbean Latin America & Caribbean (excluding high income)Latin America & the Caribbean (IDA & IBRD countries)LatviaLeast developed countries: UN classificationLebanonLesothoLiberiaLibyaLithuaniaLow & middle incomeLow incomeLower middle incomeLuxembourgMacao SAR, ChinaMacedonia, FYRMadagascarMalawiMalaysiaMaldivesMaliMaltaMauritaniaMauritiusMexicoMicronesia, Fed. Sts.Middle East & North AfricaMiddle East & North Africa (excluding high income)Middle East & North Africa (IDA & IBRD countries)Middle incomeMoldovaMongoliaMontenegroMoroccoMozambiqueNamibiaNepalNetherlandsNew CaledoniaNew ZealandNicaraguaNigerNigeriaNorth AmericaNorwayOECD membersOmanOther small statesPacific island small statesPakistanPanamaPapua New GuineaParaguayPeruPhilippinesPolandPortugalPost-demographic dividendPre-demographic dividendPuerto RicoQatarRomaniaRussian FederationRwandaSaudi ArabiaSenegalSerbiaSeychellesSierra LeoneSingaporeSlovak RepublicSloveniaSmall statesSolomon IslandsSomaliaSouth AfricaSouth AsiaSouth Asia (IDA & IBRD)South SudanSpainSri LankaSt. Kitts and NevisSt. LuciaSt. Vincent and the GrenadinesSub-Saharan Africa Sub-Saharan Africa (excluding high income)Sub-Saharan Africa (IDA & IBRD countries)SudanSurinameSwazilandSwedenSwitzerlandSyrian Arab RepublicTajikistanTanzaniaThailandTimor-LesteTogoTongaTrinidad and TobagoTunisiaTurkeyTurkmenistanUgandaUkraineUnited Arab EmiratesUnited KingdomUnited StatesUpper middle incomeUruguayUzbekistanVanuatuVenezuela, RBVietnamWest Bank and GazaWorldYemen, Rep.ZambiaZimbabwe Timeline:
This timeline shows a graph from 1984 to 2015 of Vanuatu. No data until 1983. Number of actual observations by date: 32.
Source name:
World Development Indicators
Source organization:
World Bank national accounts data, and OECD National Accounts data files.
Categories, topics:
Economy & Growth
Last updated:
apr 23, 2017
Indicators value changes by year
Minimum:
16.846
jan 1, 2004
Maximum:
40.559
jan 1, 2009
At the date of observation
Value
Absolute change
Change from previous value
jan 1, 1984
23.805
+23.805
0.0%
jan 1, 1985
19.865
-3.94
-16.55%
jan 1, 1986
25.823
+5.959
30.0%
jan 1, 1987
28.586
+2.763
10.7%
jan 1, 1988
33.113
+4.527
15.84%
jan 1, 1989
26.715
-6.398
-19.32%
jan 1, 1990
33.019
+6.304
23.6%
jan 1, 1991
33.227
+0.208
0.63%
jan 1, 1992
26.07
-7.157
-21.54%
jan 1, 1993
21.078
-4.992
-19.15%
jan 1, 1994
21.24
+0.162
0.77%
jan 1, 1995
23.207
+1.966
9.26%
jan 1, 1996
22.637
-0.57
-2.46%
jan 1, 1997
19.715
-2.922
-12.91%
jan 1, 1998
18.836
-0.878
-4.45%
jan 1, 1999
17.146
-1.69
-8.97%
jan 1, 2000
18.993
+1.847
10.77%
jan 1, 2001
19.914
+0.921
4.85%
jan 1, 2002
18.354
-1.56
-7.83%
jan 1, 2003
19.544
+1.19
6.48%
jan 1, 2004
16.846
-2.697
-13.8%
jan 1, 2005
23.238
+6.392
37.94%
jan 1, 2006
24.119
+0.881
3.79%
jan 1, 2007
28.377
+4.258
17.65%
jan 1, 2008
32.266
+3.889
13.71%
jan 1, 2009
40.559
+8.292
25.7%
jan 1, 2010
39.893
-0.666
-1.64%
jan 1, 2011
34.66
-5.234
-13.12%
jan 1, 2012
27.497
-7.162
-20.67%
jan 1, 2013
23.045
-4.452
-16.19%
jan 1, 2014
25.92
+2.875
12.48%
jan 1, 2015
26.431
+0.511
1.97%
Ranking of countries by current statistics by years


Comments: