29
/
en
AIzaSyAYiBZKx7MnpbEhh9jyipgxe19OcubqV5w
April 1, 2024
73221
Australia
AUS
true
2
1
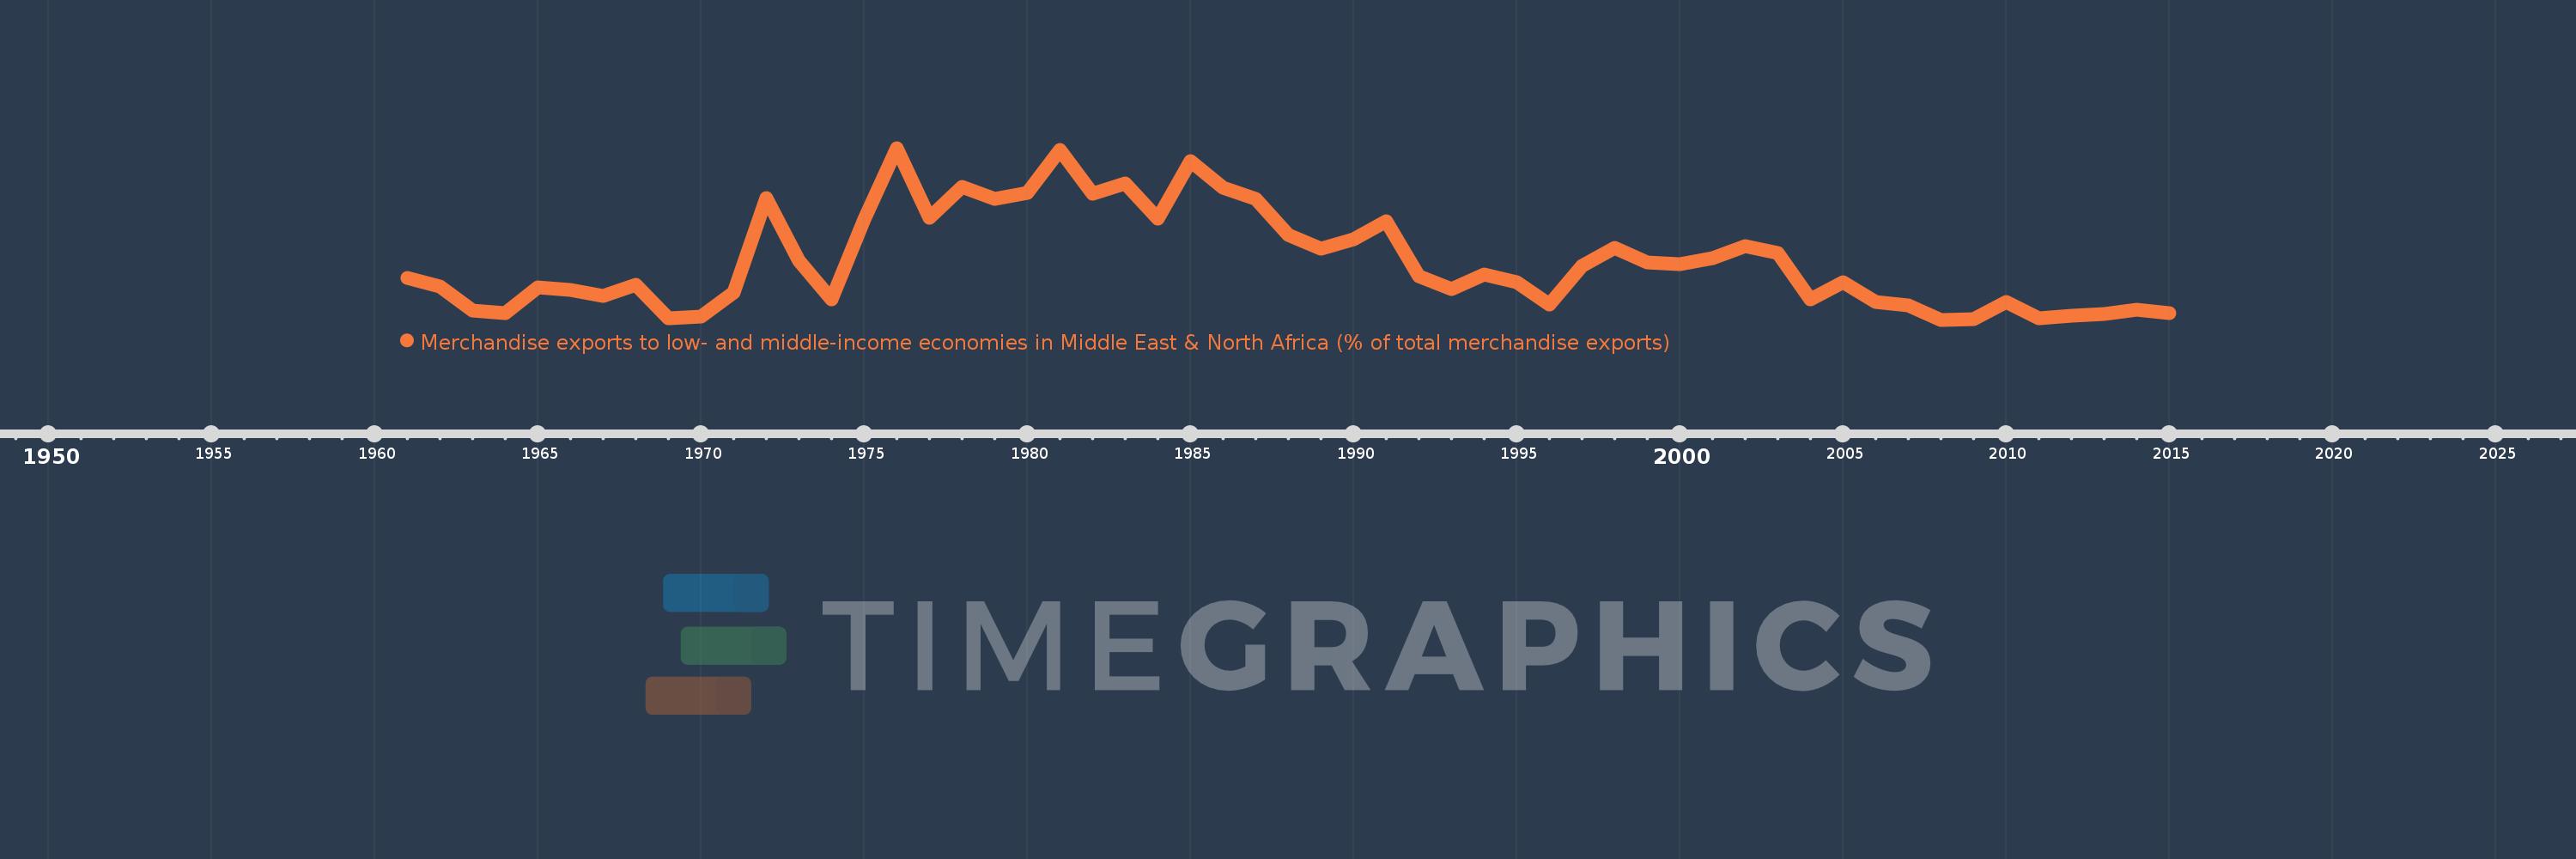
Merchandise exports to low- and middle-income economies in Middle East & North Africa (% of total merchandise exports)
2015,2014,2013,2012,2011,2010,2009,2008,2007,2006,2005,2004,2003,2002,2001,2000,1999,1998,1997,1996,1995,1994,1993,1992,1991,1990,1989,1988,1987,1986,1985,1984,1983,1982,1981,1980,1979,1978,1977,1976,1975,1974,1973,1972,1971,1970,1969,1968,1967,1966,1965,1964,1963,1962,1961
This statistics in other country:
AfghanistanAlbaniaAlgeriaAngolaArab WorldArgentinaArmeniaArubaAustraliaAustriaAzerbaijanBahamas, TheBahrainBangladeshBarbadosBelarusBelgiumBelizeBeninBermudaBoliviaBosnia and HerzegovinaBrazilBrunei DarussalamBulgariaBurkina FasoBurundiCabo VerdeCambodiaCameroonCanadaCaribbean small statesCentral African RepublicCentral Europe and the BalticsChadChileChinaColombiaComorosCongo, Dem. Rep.Congo, Rep.Costa RicaCote d'IvoireCroatiaCubaCyprusCzech RepublicDenmarkDjiboutiDominicaDominican RepublicEarly-demographic dividendEast Asia & PacificEast Asia & Pacific (excluding high income)East Asia & Pacific (IDA & IBRD countries)EcuadorEgypt, Arab Rep.El SalvadorEquatorial GuineaEstoniaEthiopiaEuro areaEurope & Central AsiaEurope & Central Asia (excluding high income)Europe & Central Asia (IDA & IBRD countries)European UnionFijiFinlandFragile and conflict affected situationsFranceGabonGambia, TheGeorgiaGermanyGhanaGreeceGreenlandGrenadaGuatemalaGuineaGuinea-BissauGuyanaHaitiHeavily indebted poor countries (HIPC)High incomeHondurasHong Kong SAR, ChinaHungaryIBRD onlyIcelandIDA & IBRD totalIDA blendIDA onlyIDA totalIndiaIndonesiaIran, Islamic Rep.IraqIrelandIsraelItalyJamaicaJapanJordanKazakhstanKenyaKorea, Dem. People’s Rep.Korea, Rep.KosovoKuwaitKyrgyz RepublicLao PDRLate-demographic dividendLatin America & Caribbean Latin America & Caribbean (excluding high income)Latin America & the Caribbean (IDA & IBRD countries)LatviaLeast developed countries: UN classificationLebanonLiberiaLibyaLithuaniaLow & middle incomeLow incomeLower middle incomeLuxembourgMacao SAR, ChinaMacedonia, FYRMadagascarMalawiMalaysiaMaliMaltaMauritaniaMauritiusMexicoMiddle East & North AfricaMiddle East & North Africa (excluding high income)Middle East & North Africa (IDA & IBRD countries)Middle incomeMoldovaMongoliaMontenegroMoroccoMozambiqueMyanmarNepalNetherlandsNew CaledoniaNew ZealandNicaraguaNigerNigeriaNorth AmericaNorwayOECD membersOmanOther small statesPacific island small statesPakistanPanamaPapua New GuineaParaguayPeruPhilippinesPolandPortugalPost-demographic dividendPre-demographic dividendQatarRomaniaRussian FederationRwandaSamoaSaudi ArabiaSenegalSerbiaSeychellesSierra LeoneSingaporeSlovak RepublicSloveniaSmall statesSomaliaSouth AfricaSouth AsiaSouth Asia (IDA & IBRD)SpainSri LankaSt. LuciaSub-Saharan Africa Sub-Saharan Africa (excluding high income)Sub-Saharan Africa (IDA & IBRD countries)SudanSurinameSwedenSwitzerlandSyrian Arab RepublicTajikistanTanzaniaThailandTogoTrinidad and TobagoTunisiaTurkeyTurkmenistanUgandaUkraineUnited Arab EmiratesUnited KingdomUnited StatesUpper middle incomeUruguayUzbekistanVenezuela, RBVietnamWorldYemen, Rep.ZambiaZimbabwe Timeline:
This timeline shows a graph from 1961 to 2015 of Australia. No data until 1960. Number of actual observations by date: 55.
Source name:
World Development Indicators
Source organization:
World Bank staff estimates based data from International Monetary Fund's Direction of Trade database.
Categories, topics:
Private Sector, Trade
Last updated:
apr 23, 2017
Indicators value changes by year
At the date of observation
Value
Absolute change
Change from previous value
jan 1, 1961
1.508
+1.508
0.0%
jan 1, 1962
1.296
-0.212
-14.06%
jan 1, 1963
0.749
-0.547
-42.19%
jan 1, 1964
0.685
-0.064
-8.57%
jan 1, 1965
1.283
+0.598
87.34%
jan 1, 1966
1.219
-0.064
-4.95%
jan 1, 1967
1.079
-0.14
-11.52%
jan 1, 1968
1.343
+0.263
24.42%
jan 1, 1969
0.565
-0.777
-57.9%
jan 1, 1970
0.596
+0.031
5.49%
jan 1, 1971
1.165
+0.569
95.43%
jan 1, 1972
3.367
+2.202
188.95%
jan 1, 1973
1.907
-1.46
-43.36%
jan 1, 1974
0.998
-0.909
-47.69%
jan 1, 1975
2.855
+1.857
186.19%
jan 1, 1976
4.533
+1.678
58.78%
jan 1, 1977
2.901
-1.632
-35.99%
jan 1, 1978
3.633
+0.732
25.22%
jan 1, 1979
3.344
-0.289
-7.97%
jan 1, 1980
3.482
+0.138
4.14%
jan 1, 1981
4.489
+1.007
28.93%
jan 1, 1982
3.469
-1.021
-22.73%
jan 1, 1983
3.713
+0.244
7.05%
jan 1, 1984
2.875
-0.838
-22.57%
jan 1, 1985
4.228
+1.353
47.07%
jan 1, 1986
3.614
-0.614
-14.53%
jan 1, 1987
3.342
-0.271
-7.51%
jan 1, 1988
2.51
-0.832
-24.89%
jan 1, 1989
2.191
-0.319
-12.71%
jan 1, 1990
2.408
+0.217
9.88%
jan 1, 1991
2.826
+0.418
17.36%
jan 1, 1992
1.548
-1.278
-45.22%
jan 1, 1993
1.235
-0.313
-20.25%
jan 1, 1994
1.585
+0.35
28.36%
jan 1, 1995
1.393
-0.191
-12.08%
jan 1, 1996
0.876
-0.518
-37.15%
jan 1, 1997
1.792
+0.916
104.63%
jan 1, 1998
2.209
+0.418
23.3%
jan 1, 1999
1.873
-0.337
-15.24%
jan 1, 2000
1.823
-0.049
-2.63%
jan 1, 2001
1.962
+0.139
7.61%
jan 1, 2002
2.246
+0.284
14.46%
jan 1, 2003
2.076
-0.17
-7.59%
jan 1, 2004
0.998
-1.078
-51.92%
jan 1, 2005
1.409
+0.411
41.19%
jan 1, 2006
0.936
-0.473
-33.56%
jan 1, 2007
0.859
-0.077
-8.2%
jan 1, 2008
0.527
-0.332
-38.61%
jan 1, 2009
0.546
+0.019
3.56%
jan 1, 2010
0.932
+0.386
70.65%
jan 1, 2011
0.558
-0.374
-40.1%
jan 1, 2012
0.629
+0.071
12.64%
jan 1, 2013
0.671
+0.042
6.75%
jan 1, 2014
0.764
+0.093
13.8%
jan 1, 2015
0.684
-0.08
-10.53%
Ranking of countries by current statistics by years


Comments: