29
/
en
AIzaSyAYiBZKx7MnpbEhh9jyipgxe19OcubqV5w
April 1, 2024
234879
Saudi Arabia
SAU
true
2
1
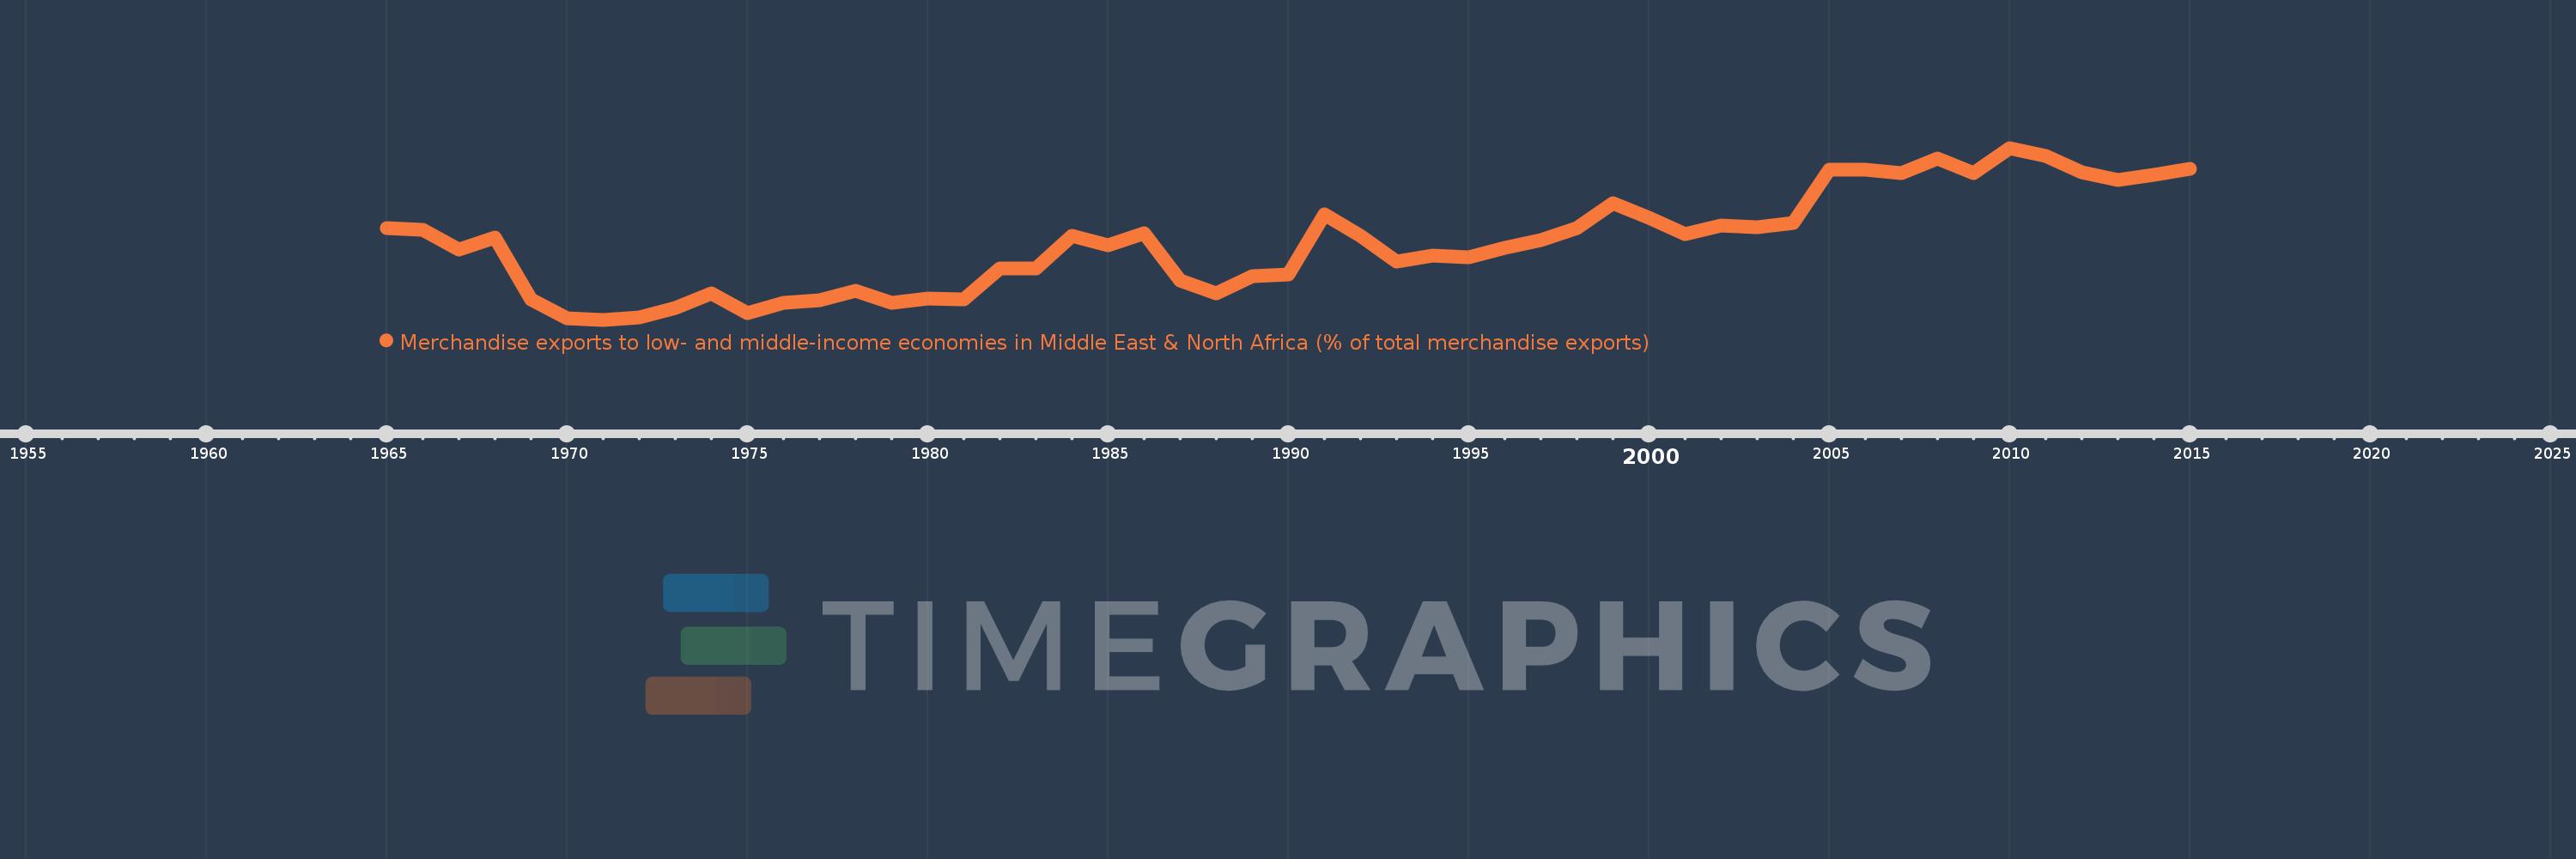
Merchandise exports to low- and middle-income economies in Middle East & North Africa (% of total merchandise exports)
2015,2014,2013,2012,2011,2010,2009,2008,2007,2006,2005,2004,2003,2002,2001,2000,1999,1998,1997,1996,1995,1994,1993,1992,1991,1990,1989,1988,1987,1986,1985,1984,1983,1982,1981,1980,1979,1978,1977,1976,1975,1974,1973,1972,1971,1970,1969,1968,1967,1966,1965
This statistics in other country:
AfghanistanAlbaniaAlgeriaAngolaArab WorldArgentinaArmeniaArubaAustraliaAustriaAzerbaijanBahamas, TheBahrainBangladeshBarbadosBelarusBelgiumBelizeBeninBermudaBoliviaBosnia and HerzegovinaBrazilBrunei DarussalamBulgariaBurkina FasoBurundiCabo VerdeCambodiaCameroonCanadaCaribbean small statesCentral African RepublicCentral Europe and the BalticsChadChileChinaColombiaComorosCongo, Dem. Rep.Congo, Rep.Costa RicaCote d'IvoireCroatiaCubaCyprusCzech RepublicDenmarkDjiboutiDominicaDominican RepublicEarly-demographic dividendEast Asia & PacificEast Asia & Pacific (excluding high income)East Asia & Pacific (IDA & IBRD countries)EcuadorEgypt, Arab Rep.El SalvadorEquatorial GuineaEstoniaEthiopiaEuro areaEurope & Central AsiaEurope & Central Asia (excluding high income)Europe & Central Asia (IDA & IBRD countries)European UnionFijiFinlandFragile and conflict affected situationsFranceGabonGambia, TheGeorgiaGermanyGhanaGreeceGreenlandGrenadaGuatemalaGuineaGuinea-BissauGuyanaHaitiHeavily indebted poor countries (HIPC)High incomeHondurasHong Kong SAR, ChinaHungaryIBRD onlyIcelandIDA & IBRD totalIDA blendIDA onlyIDA totalIndiaIndonesiaIran, Islamic Rep.IraqIrelandIsraelItalyJamaicaJapanJordanKazakhstanKenyaKorea, Dem. People’s Rep.Korea, Rep.KosovoKuwaitKyrgyz RepublicLao PDRLate-demographic dividendLatin America & Caribbean Latin America & Caribbean (excluding high income)Latin America & the Caribbean (IDA & IBRD countries)LatviaLeast developed countries: UN classificationLebanonLiberiaLibyaLithuaniaLow & middle incomeLow incomeLower middle incomeLuxembourgMacao SAR, ChinaMacedonia, FYRMadagascarMalawiMalaysiaMaliMaltaMauritaniaMauritiusMexicoMiddle East & North AfricaMiddle East & North Africa (excluding high income)Middle East & North Africa (IDA & IBRD countries)Middle incomeMoldovaMongoliaMontenegroMoroccoMozambiqueMyanmarNepalNetherlandsNew CaledoniaNew ZealandNicaraguaNigerNigeriaNorth AmericaNorwayOECD membersOmanOther small statesPacific island small statesPakistanPanamaPapua New GuineaParaguayPeruPhilippinesPolandPortugalPost-demographic dividendPre-demographic dividendQatarRomaniaRussian FederationRwandaSamoaSaudi ArabiaSenegalSerbiaSeychellesSierra LeoneSingaporeSlovak RepublicSloveniaSmall statesSomaliaSouth AfricaSouth AsiaSouth Asia (IDA & IBRD)SpainSri LankaSt. LuciaSub-Saharan Africa Sub-Saharan Africa (excluding high income)Sub-Saharan Africa (IDA & IBRD countries)SudanSurinameSwedenSwitzerlandSyrian Arab RepublicTajikistanTanzaniaThailandTogoTrinidad and TobagoTunisiaTurkeyTurkmenistanUgandaUkraineUnited Arab EmiratesUnited KingdomUnited StatesUpper middle incomeUruguayUzbekistanVenezuela, RBVietnamWorldYemen, Rep.ZambiaZimbabwe Timeline:
This timeline shows a graph from 1965 to 2015 of Saudi Arabia. No data until 1964. Number of actual observations by date: 51.
Source name:
World Development Indicators
Source organization:
World Bank staff estimates based data from International Monetary Fund's Direction of Trade database.
Categories, topics:
Private Sector, Trade
Last updated:
apr 23, 2017
Indicators value changes by year
At the date of observation
Value
Absolute change
Change from previous value
jan 1, 1965
3.165
+3.165
0.0%
jan 1, 1966
3.123
-0.043
-1.35%
jan 1, 1967
2.579
-0.543
-17.39%
jan 1, 1968
2.896
+0.317
12.27%
jan 1, 1969
1.204
-1.692
-58.41%
jan 1, 1970
0.704
-0.501
-41.58%
jan 1, 1971
0.653
-0.051
-7.18%
jan 1, 1972
0.721
+0.068
10.41%
jan 1, 1973
0.969
+0.248
34.42%
jan 1, 1974
1.366
+0.396
40.9%
jan 1, 1975
0.833
-0.532
-38.99%
jan 1, 1976
1.107
+0.274
32.86%
jan 1, 1977
1.178
+0.072
6.46%
jan 1, 1978
1.451
+0.273
23.16%
jan 1, 1979
1.108
-0.343
-23.64%
jan 1, 1980
1.229
+0.121
10.89%
jan 1, 1981
1.2
-0.029
-2.38%
jan 1, 1982
2.049
+0.849
70.77%
jan 1, 1983
2.057
+0.008
0.41%
jan 1, 1984
2.96
+0.903
43.92%
jan 1, 1985
2.692
-0.268
-9.05%
jan 1, 1986
3.016
+0.323
12.01%
jan 1, 1987
1.717
-1.299
-43.07%
jan 1, 1988
1.376
-0.34
-19.83%
jan 1, 1989
1.841
+0.465
33.79%
jan 1, 1990
1.886
+0.045
2.44%
jan 1, 1991
3.544
+1.658
87.88%
jan 1, 1992
2.96
-0.584
-16.47%
jan 1, 1993
2.242
-0.718
-24.26%
jan 1, 1994
2.413
+0.171
7.64%
jan 1, 1995
2.365
-0.048
-1.99%
jan 1, 1996
2.611
+0.246
10.4%
jan 1, 1997
2.823
+0.212
8.1%
jan 1, 1998
3.173
+0.351
12.42%
jan 1, 1999
3.84
+0.666
20.99%
jan 1, 2000
3.449
-0.391
-10.18%
jan 1, 2001
3.0
-0.449
-13.01%
jan 1, 2002
3.235
+0.235
7.83%
jan 1, 2003
3.189
-0.045
-1.41%
jan 1, 2004
3.292
+0.103
3.22%
jan 1, 2005
4.763
+1.471
44.67%
jan 1, 2006
4.771
+0.008
0.16%
jan 1, 2007
4.677
-0.094
-1.96%
jan 1, 2008
5.073
+0.396
8.47%
jan 1, 2009
4.669
-0.404
-7.96%
jan 1, 2010
5.356
+0.687
14.72%
jan 1, 2011
5.126
-0.231
-4.31%
jan 1, 2012
4.694
-0.432
-8.42%
jan 1, 2013
4.486
-0.208
-4.43%
jan 1, 2014
4.622
+0.136
3.04%
jan 1, 2015
4.786
+0.164
3.55%
Ranking of countries by current statistics by years


Comments: