29
/
en
AIzaSyAYiBZKx7MnpbEhh9jyipgxe19OcubqV5w
April 1, 2024
257556
Switzerland
CHE
true
2
1
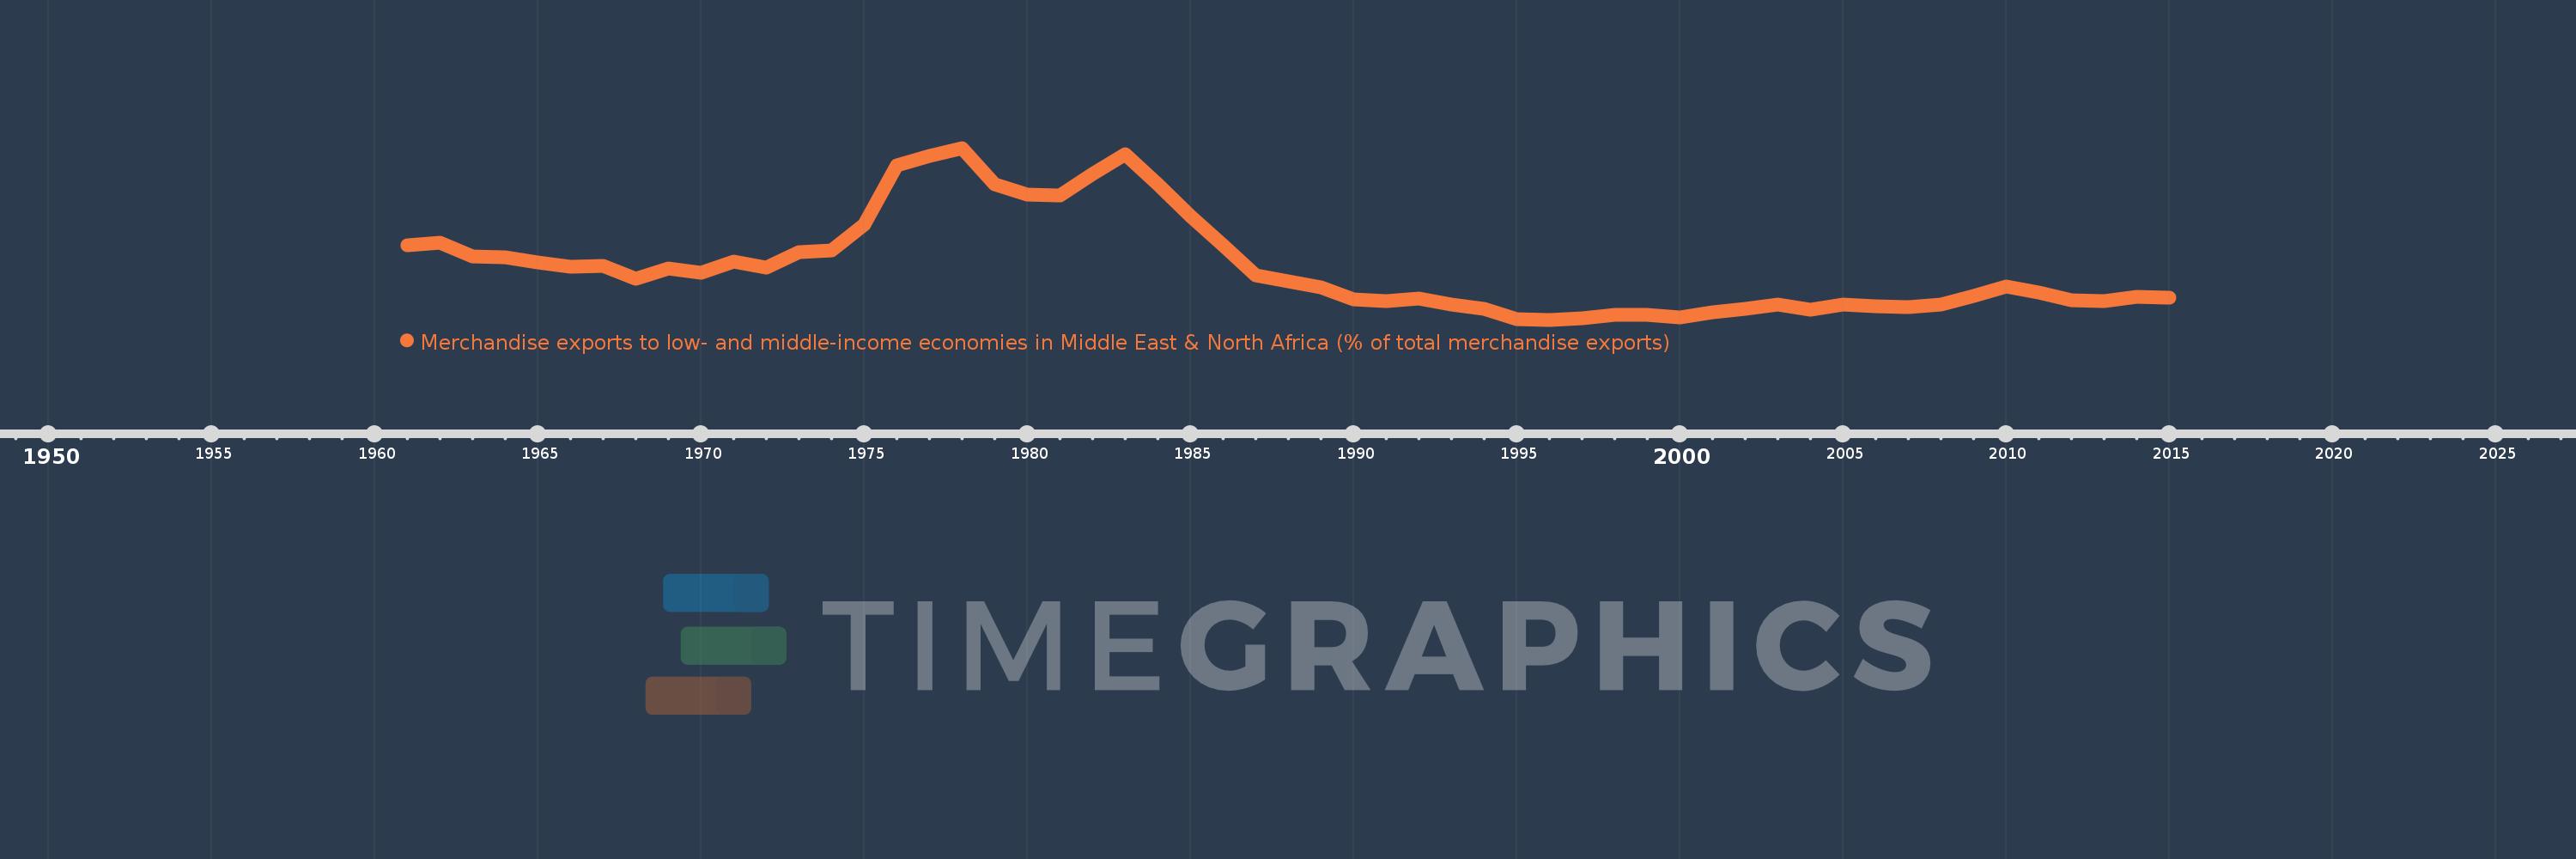
Merchandise exports to low- and middle-income economies in Middle East & North Africa (% of total merchandise exports)
2015,2014,2013,2012,2011,2010,2009,2008,2007,2006,2005,2004,2003,2002,2001,2000,1999,1998,1997,1996,1995,1994,1993,1992,1991,1990,1989,1988,1987,1986,1985,1984,1983,1982,1981,1980,1979,1978,1977,1976,1975,1974,1973,1972,1971,1970,1969,1968,1967,1966,1965,1964,1963,1962,1961
This statistics in other country:
AfghanistanAlbaniaAlgeriaAngolaArab WorldArgentinaArmeniaArubaAustraliaAustriaAzerbaijanBahamas, TheBahrainBangladeshBarbadosBelarusBelgiumBelizeBeninBermudaBoliviaBosnia and HerzegovinaBrazilBrunei DarussalamBulgariaBurkina FasoBurundiCabo VerdeCambodiaCameroonCanadaCaribbean small statesCentral African RepublicCentral Europe and the BalticsChadChileChinaColombiaComorosCongo, Dem. Rep.Congo, Rep.Costa RicaCote d'IvoireCroatiaCubaCyprusCzech RepublicDenmarkDjiboutiDominicaDominican RepublicEarly-demographic dividendEast Asia & PacificEast Asia & Pacific (excluding high income)East Asia & Pacific (IDA & IBRD countries)EcuadorEgypt, Arab Rep.El SalvadorEquatorial GuineaEstoniaEthiopiaEuro areaEurope & Central AsiaEurope & Central Asia (excluding high income)Europe & Central Asia (IDA & IBRD countries)European UnionFijiFinlandFragile and conflict affected situationsFranceGabonGambia, TheGeorgiaGermanyGhanaGreeceGreenlandGrenadaGuatemalaGuineaGuinea-BissauGuyanaHaitiHeavily indebted poor countries (HIPC)High incomeHondurasHong Kong SAR, ChinaHungaryIBRD onlyIcelandIDA & IBRD totalIDA blendIDA onlyIDA totalIndiaIndonesiaIran, Islamic Rep.IraqIrelandIsraelItalyJamaicaJapanJordanKazakhstanKenyaKorea, Dem. People’s Rep.Korea, Rep.KosovoKuwaitKyrgyz RepublicLao PDRLate-demographic dividendLatin America & Caribbean Latin America & Caribbean (excluding high income)Latin America & the Caribbean (IDA & IBRD countries)LatviaLeast developed countries: UN classificationLebanonLiberiaLibyaLithuaniaLow & middle incomeLow incomeLower middle incomeLuxembourgMacao SAR, ChinaMacedonia, FYRMadagascarMalawiMalaysiaMaliMaltaMauritaniaMauritiusMexicoMiddle East & North AfricaMiddle East & North Africa (excluding high income)Middle East & North Africa (IDA & IBRD countries)Middle incomeMoldovaMongoliaMontenegroMoroccoMozambiqueMyanmarNepalNetherlandsNew CaledoniaNew ZealandNicaraguaNigerNigeriaNorth AmericaNorwayOECD membersOmanOther small statesPacific island small statesPakistanPanamaPapua New GuineaParaguayPeruPhilippinesPolandPortugalPost-demographic dividendPre-demographic dividendQatarRomaniaRussian FederationRwandaSamoaSaudi ArabiaSenegalSerbiaSeychellesSierra LeoneSingaporeSlovak RepublicSloveniaSmall statesSomaliaSouth AfricaSouth AsiaSouth Asia (IDA & IBRD)SpainSri LankaSt. LuciaSub-Saharan Africa Sub-Saharan Africa (excluding high income)Sub-Saharan Africa (IDA & IBRD countries)SudanSurinameSwedenSwitzerlandSyrian Arab RepublicTajikistanTanzaniaThailandTogoTrinidad and TobagoTunisiaTurkeyTurkmenistanUgandaUkraineUnited Arab EmiratesUnited KingdomUnited StatesUpper middle incomeUruguayUzbekistanVenezuela, RBVietnamWorldYemen, Rep.ZambiaZimbabwe Timeline:
This timeline shows a graph from 1961 to 2015 of Switzerland. No data until 1960. Number of actual observations by date: 55.
Source name:
World Development Indicators
Source organization:
World Bank staff estimates based data from International Monetary Fund's Direction of Trade database.
Categories, topics:
Private Sector, Trade
Last updated:
apr 23, 2017
Indicators value changes by year
At the date of observation
Value
Absolute change
Change from previous value
jan 1, 1961
2.917
+2.917
0.0%
jan 1, 1962
2.989
+0.072
2.46%
jan 1, 1963
2.674
-0.315
-10.53%
jan 1, 1964
2.65
-0.024
-0.9%
jan 1, 1965
2.532
-0.118
-4.46%
jan 1, 1966
2.427
-0.105
-4.14%
jan 1, 1967
2.443
+0.016
0.67%
jan 1, 1968
2.158
-0.285
-11.67%
jan 1, 1969
2.4
+0.242
11.19%
jan 1, 1970
2.29
-0.11
-4.59%
jan 1, 1971
2.544
+0.255
11.13%
jan 1, 1972
2.418
-0.126
-4.95%
jan 1, 1973
2.766
+0.348
14.38%
jan 1, 1974
2.802
+0.036
1.29%
jan 1, 1975
3.395
+0.593
21.18%
jan 1, 1976
4.756
+1.361
40.08%
jan 1, 1977
4.978
+0.222
4.67%
jan 1, 1978
5.162
+0.183
3.69%
jan 1, 1979
4.333
-0.828
-16.05%
jan 1, 1980
4.082
-0.251
-5.79%
jan 1, 1981
4.071
-0.011
-0.26%
jan 1, 1982
4.555
+0.484
11.89%
jan 1, 1983
5.017
+0.462
10.14%
jan 1, 1984
4.32
-0.698
-13.9%
jan 1, 1985
3.596
-0.724
-16.76%
jan 1, 1986
2.923
-0.672
-18.7%
jan 1, 1987
2.232
-0.691
-23.64%
jan 1, 1988
2.096
-0.136
-6.09%
jan 1, 1989
1.964
-0.133
-6.33%
jan 1, 1990
1.673
-0.291
-14.81%
jan 1, 1991
1.64
-0.033
-1.99%
jan 1, 1992
1.706
+0.066
4.04%
jan 1, 1993
1.559
-0.146
-8.58%
jan 1, 1994
1.459
-0.1
-6.44%
jan 1, 1995
1.219
-0.24
-16.46%
jan 1, 1996
1.212
-0.007
-0.59%
jan 1, 1997
1.252
+0.04
3.33%
jan 1, 1998
1.334
+0.082
6.58%
jan 1, 1999
1.334
-0.001
-0.05%
jan 1, 2000
1.261
-0.072
-5.43%
jan 1, 2001
1.389
+0.128
10.12%
jan 1, 2002
1.464
+0.075
5.41%
jan 1, 2003
1.557
+0.092
6.31%
jan 1, 2004
1.448
-0.108
-6.95%
jan 1, 2005
1.553
+0.105
7.25%
jan 1, 2006
1.526
-0.028
-1.79%
jan 1, 2007
1.512
-0.013
-0.88%
jan 1, 2008
1.562
+0.05
3.33%
jan 1, 2009
1.755
+0.193
12.35%
jan 1, 2010
1.986
+0.23
13.12%
jan 1, 2011
1.844
-0.142
-7.14%
jan 1, 2012
1.667
-0.177
-9.58%
jan 1, 2013
1.639
-0.028
-1.7%
jan 1, 2014
1.746
+0.106
6.49%
jan 1, 2015
1.719
-0.027
-1.55%
Ranking of countries by current statistics by years


Comments: