29
/
en
AIzaSyAYiBZKx7MnpbEhh9jyipgxe19OcubqV5w
April 1, 2024
113861
Cote d'Ivoire
CIV
true
2
1
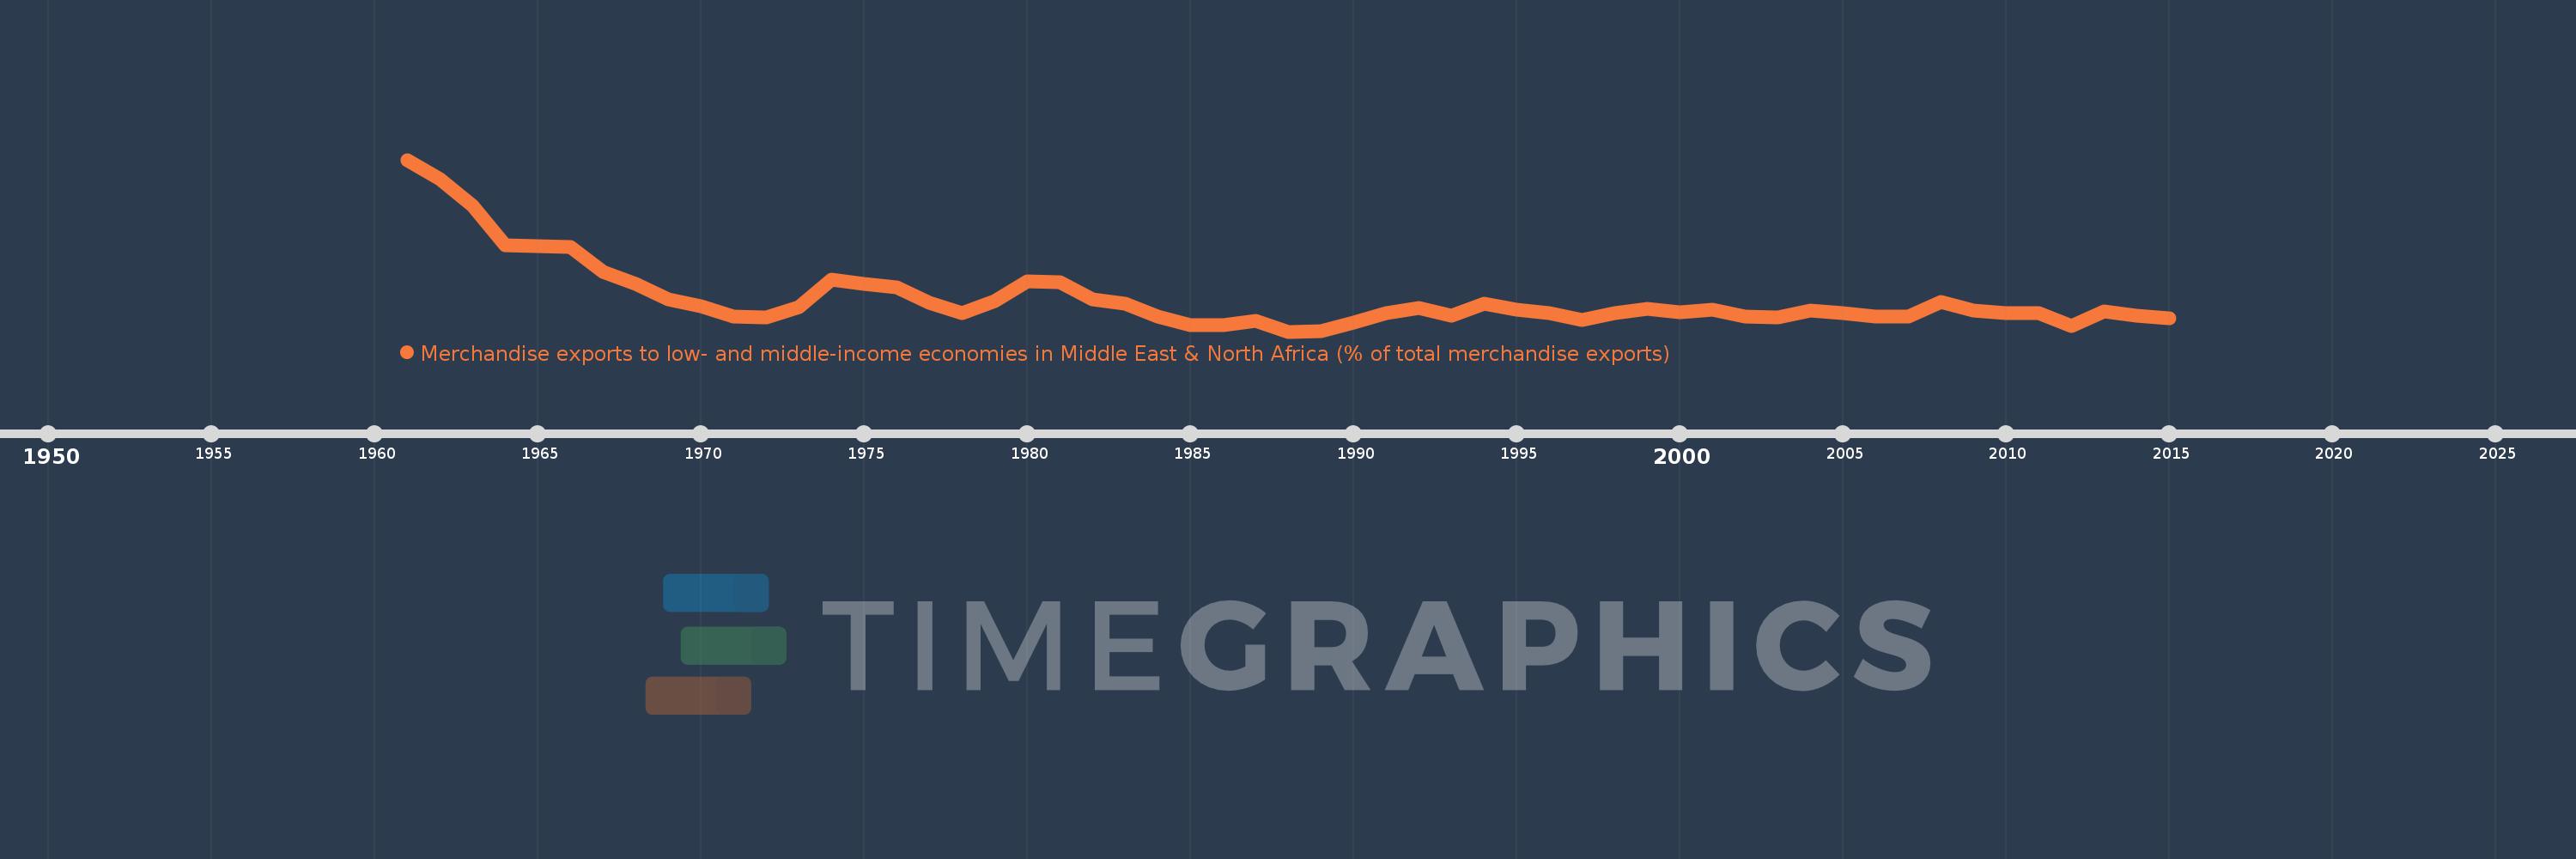
Merchandise exports to low- and middle-income economies in Middle East & North Africa (% of total merchandise exports)
2015,2014,2013,2012,2011,2010,2009,2008,2007,2006,2005,2004,2003,2002,2001,2000,1999,1998,1997,1996,1995,1994,1993,1992,1991,1990,1989,1988,1987,1986,1985,1984,1983,1982,1981,1980,1979,1978,1977,1976,1975,1974,1973,1972,1971,1970,1969,1968,1967,1966,1965,1964,1963,1962,1961
This statistics in other country:
AfghanistanAlbaniaAlgeriaAngolaArab WorldArgentinaArmeniaArubaAustraliaAustriaAzerbaijanBahamas, TheBahrainBangladeshBarbadosBelarusBelgiumBelizeBeninBermudaBoliviaBosnia and HerzegovinaBrazilBrunei DarussalamBulgariaBurkina FasoBurundiCabo VerdeCambodiaCameroonCanadaCaribbean small statesCentral African RepublicCentral Europe and the BalticsChadChileChinaColombiaComorosCongo, Dem. Rep.Congo, Rep.Costa RicaCote d'IvoireCroatiaCubaCyprusCzech RepublicDenmarkDjiboutiDominicaDominican RepublicEarly-demographic dividendEast Asia & PacificEast Asia & Pacific (excluding high income)East Asia & Pacific (IDA & IBRD countries)EcuadorEgypt, Arab Rep.El SalvadorEquatorial GuineaEstoniaEthiopiaEuro areaEurope & Central AsiaEurope & Central Asia (excluding high income)Europe & Central Asia (IDA & IBRD countries)European UnionFijiFinlandFragile and conflict affected situationsFranceGabonGambia, TheGeorgiaGermanyGhanaGreeceGreenlandGrenadaGuatemalaGuineaGuinea-BissauGuyanaHaitiHeavily indebted poor countries (HIPC)High incomeHondurasHong Kong SAR, ChinaHungaryIBRD onlyIcelandIDA & IBRD totalIDA blendIDA onlyIDA totalIndiaIndonesiaIran, Islamic Rep.IraqIrelandIsraelItalyJamaicaJapanJordanKazakhstanKenyaKorea, Dem. People’s Rep.Korea, Rep.KosovoKuwaitKyrgyz RepublicLao PDRLate-demographic dividendLatin America & Caribbean Latin America & Caribbean (excluding high income)Latin America & the Caribbean (IDA & IBRD countries)LatviaLeast developed countries: UN classificationLebanonLiberiaLibyaLithuaniaLow & middle incomeLow incomeLower middle incomeLuxembourgMacao SAR, ChinaMacedonia, FYRMadagascarMalawiMalaysiaMaliMaltaMauritaniaMauritiusMexicoMiddle East & North AfricaMiddle East & North Africa (excluding high income)Middle East & North Africa (IDA & IBRD countries)Middle incomeMoldovaMongoliaMontenegroMoroccoMozambiqueMyanmarNepalNetherlandsNew CaledoniaNew ZealandNicaraguaNigerNigeriaNorth AmericaNorwayOECD membersOmanOther small statesPacific island small statesPakistanPanamaPapua New GuineaParaguayPeruPhilippinesPolandPortugalPost-demographic dividendPre-demographic dividendQatarRomaniaRussian FederationRwandaSamoaSaudi ArabiaSenegalSerbiaSeychellesSierra LeoneSingaporeSlovak RepublicSloveniaSmall statesSomaliaSouth AfricaSouth AsiaSouth Asia (IDA & IBRD)SpainSri LankaSt. LuciaSub-Saharan Africa Sub-Saharan Africa (excluding high income)Sub-Saharan Africa (IDA & IBRD countries)SudanSurinameSwedenSwitzerlandSyrian Arab RepublicTajikistanTanzaniaThailandTogoTrinidad and TobagoTunisiaTurkeyTurkmenistanUgandaUkraineUnited Arab EmiratesUnited KingdomUnited StatesUpper middle incomeUruguayUzbekistanVenezuela, RBVietnamWorldYemen, Rep.ZambiaZimbabwe Timeline:
This timeline shows a graph from 1961 to 2015 of Cote d'Ivoire. No data until 1960. Number of actual observations by date: 55.
Source name:
World Development Indicators
Source organization:
World Bank staff estimates based data from International Monetary Fund's Direction of Trade database.
Categories, topics:
Private Sector, Trade
Last updated:
apr 23, 2017
Indicators value changes by year
Maximum:
11.191
jan 1, 1961
At the date of observation
Value
Absolute change
Change from previous value
jan 1, 1961
11.191
+11.191
0.0%
jan 1, 1962
9.949
-1.242
-11.1%
jan 1, 1963
8.286
-1.664
-16.72%
jan 1, 1964
5.734
-2.552
-30.8%
jan 1, 1965
5.703
-0.031
-0.54%
jan 1, 1966
5.632
-0.071
-1.25%
jan 1, 1967
4.088
-1.544
-27.42%
jan 1, 1968
3.301
-0.787
-19.24%
jan 1, 1969
2.32
-0.981
-29.73%
jan 1, 1970
1.904
-0.415
-17.9%
jan 1, 1971
1.23
-0.674
-35.39%
jan 1, 1972
1.185
-0.046
-3.71%
jan 1, 1973
1.838
+0.654
55.17%
jan 1, 1974
3.575
+1.736
94.46%
jan 1, 1975
3.3
-0.275
-7.69%
jan 1, 1976
3.081
-0.218
-6.62%
jan 1, 1977
2.107
-0.974
-31.61%
jan 1, 1978
1.436
-0.671
-31.86%
jan 1, 1979
2.214
+0.778
54.15%
jan 1, 1980
3.454
+1.24
56.02%
jan 1, 1981
3.418
-0.035
-1.02%
jan 1, 1982
2.294
-1.125
-32.9%
jan 1, 1983
2.069
-0.225
-9.81%
jan 1, 1984
1.22
-0.849
-41.03%
jan 1, 1985
0.697
-0.523
-42.84%
jan 1, 1986
0.665
-0.032
-4.58%
jan 1, 1987
0.951
+0.286
43.01%
jan 1, 1988
0.267
-0.685
-71.95%
jan 1, 1989
0.292
+0.026
9.58%
jan 1, 1990
0.863
+0.571
195.09%
jan 1, 1991
1.449
+0.586
67.91%
jan 1, 1992
1.777
+0.328
22.64%
jan 1, 1993
1.304
-0.473
-26.62%
jan 1, 1994
2.067
+0.763
58.5%
jan 1, 1995
1.649
-0.418
-20.23%
jan 1, 1996
1.423
-0.226
-13.7%
jan 1, 1997
1.005
-0.418
-29.4%
jan 1, 1998
1.468
+0.463
46.11%
jan 1, 1999
1.69
+0.222
15.12%
jan 1, 2000
1.506
-0.184
-10.86%
jan 1, 2001
1.686
+0.18
11.94%
jan 1, 2002
1.207
-0.48
-28.44%
jan 1, 2003
1.195
-0.011
-0.94%
jan 1, 2004
1.587
+0.391
32.74%
jan 1, 2005
1.423
-0.163
-10.3%
jan 1, 2006
1.235
-0.188
-13.21%
jan 1, 2007
1.248
+0.013
1.03%
jan 1, 2008
2.139
+0.891
71.4%
jan 1, 2009
1.612
-0.527
-24.65%
jan 1, 2010
1.428
-0.183
-11.38%
jan 1, 2011
1.438
+0.01
0.68%
jan 1, 2012
0.649
-0.79
-54.9%
jan 1, 2013
1.533
+0.884
136.33%
jan 1, 2014
1.262
-0.271
-17.69%
jan 1, 2015
1.087
-0.174
-13.82%
Ranking of countries by current statistics by years


Comments: