29
/
en
AIzaSyAYiBZKx7MnpbEhh9jyipgxe19OcubqV5w
April 1, 2024
25900
Central Europe and the Baltics
CEB
false
2
1
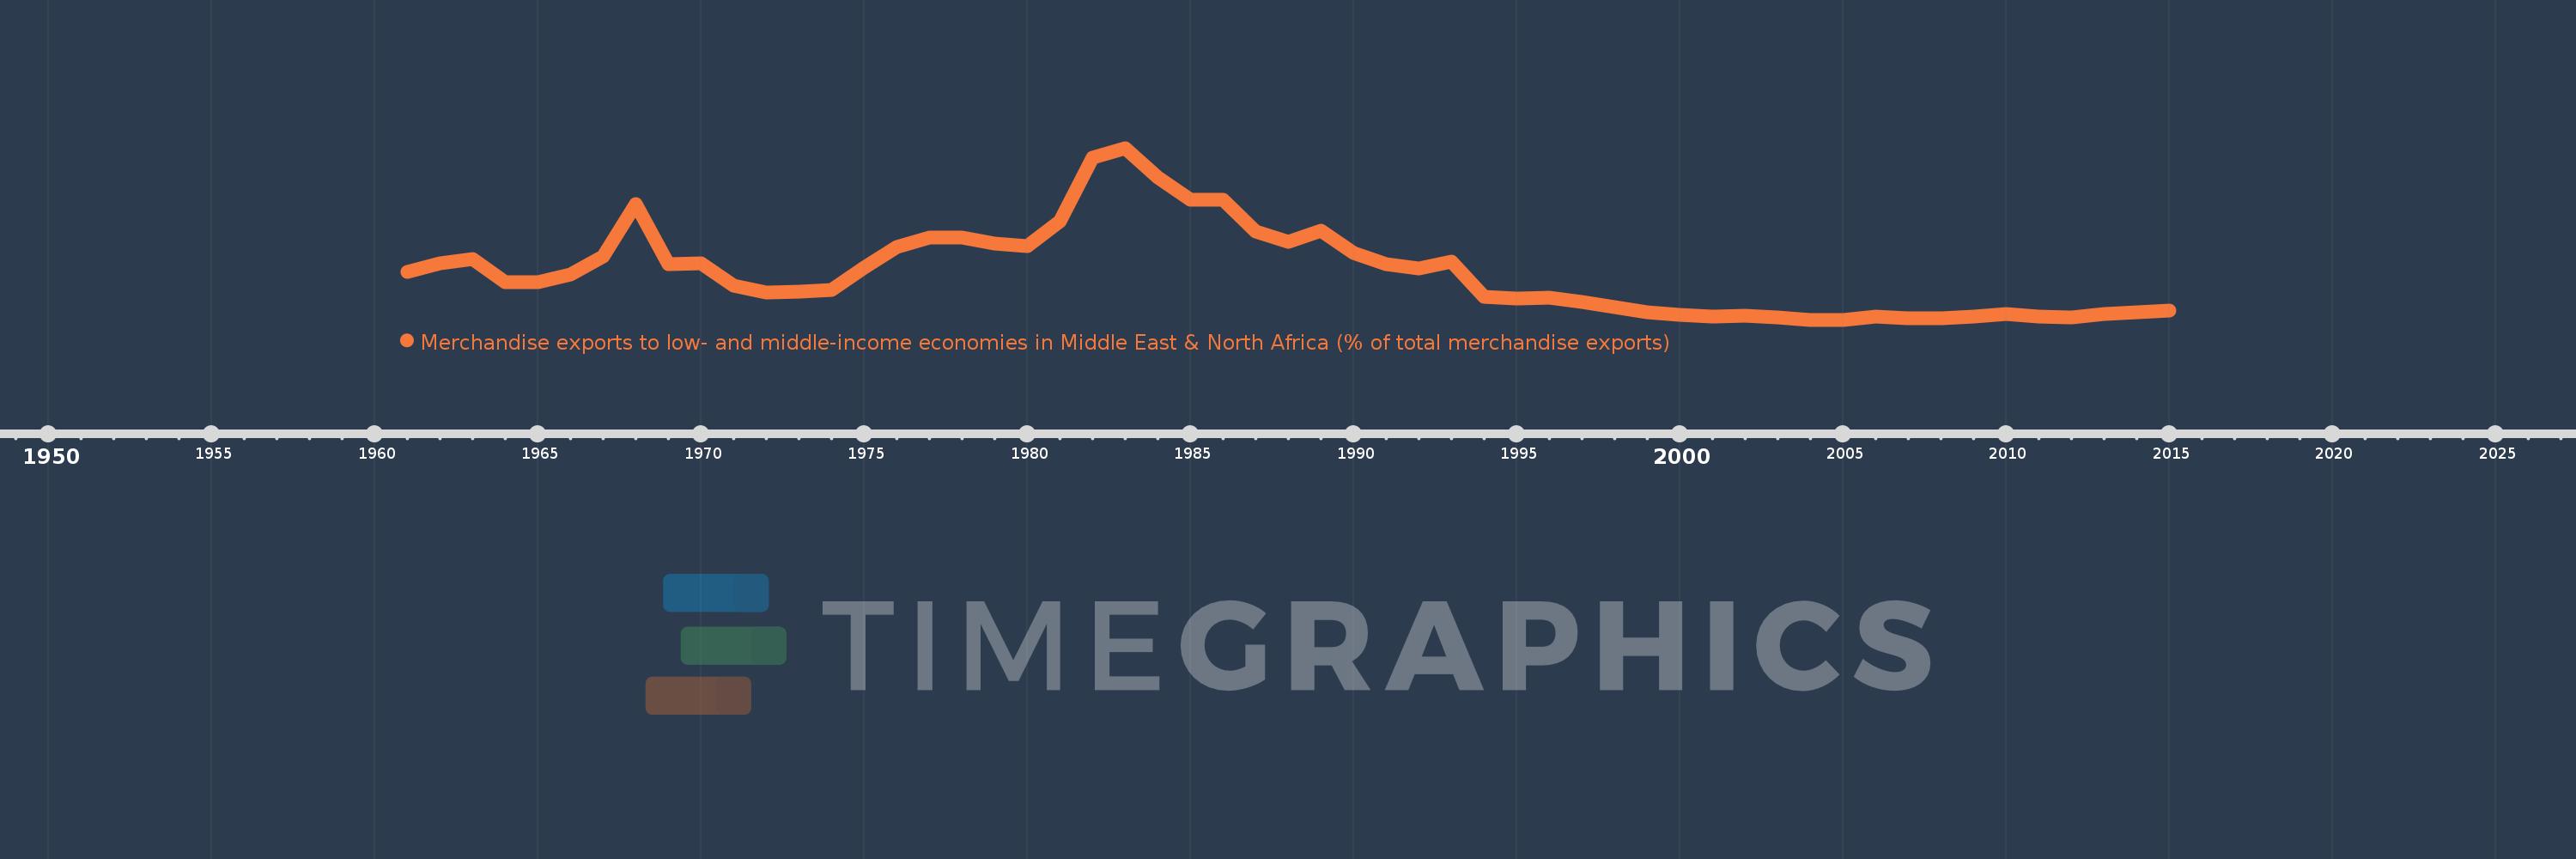
Merchandise exports to low- and middle-income economies in Middle East & North Africa (% of total merchandise exports)
2015,2014,2013,2012,2011,2010,2009,2008,2007,2006,2005,2004,2003,2002,2001,2000,1999,1998,1997,1996,1995,1994,1993,1992,1991,1990,1989,1988,1987,1986,1985,1984,1983,1982,1981,1980,1979,1978,1977,1976,1975,1974,1973,1972,1971,1970,1969,1968,1967,1966,1965,1964,1963,1962,1961
This statistics in other country:
AfghanistanAlbaniaAlgeriaAngolaArab WorldArgentinaArmeniaArubaAustraliaAustriaAzerbaijanBahamas, TheBahrainBangladeshBarbadosBelarusBelgiumBelizeBeninBermudaBoliviaBosnia and HerzegovinaBrazilBrunei DarussalamBulgariaBurkina FasoBurundiCabo VerdeCambodiaCameroonCanadaCaribbean small statesCentral African RepublicCentral Europe and the BalticsChadChileChinaColombiaComorosCongo, Dem. Rep.Congo, Rep.Costa RicaCote d'IvoireCroatiaCubaCyprusCzech RepublicDenmarkDjiboutiDominicaDominican RepublicEarly-demographic dividendEast Asia & PacificEast Asia & Pacific (excluding high income)East Asia & Pacific (IDA & IBRD countries)EcuadorEgypt, Arab Rep.El SalvadorEquatorial GuineaEstoniaEthiopiaEuro areaEurope & Central AsiaEurope & Central Asia (excluding high income)Europe & Central Asia (IDA & IBRD countries)European UnionFijiFinlandFragile and conflict affected situationsFranceGabonGambia, TheGeorgiaGermanyGhanaGreeceGreenlandGrenadaGuatemalaGuineaGuinea-BissauGuyanaHaitiHeavily indebted poor countries (HIPC)High incomeHondurasHong Kong SAR, ChinaHungaryIBRD onlyIcelandIDA & IBRD totalIDA blendIDA onlyIDA totalIndiaIndonesiaIran, Islamic Rep.IraqIrelandIsraelItalyJamaicaJapanJordanKazakhstanKenyaKorea, Dem. People’s Rep.Korea, Rep.KosovoKuwaitKyrgyz RepublicLao PDRLate-demographic dividendLatin America & Caribbean Latin America & Caribbean (excluding high income)Latin America & the Caribbean (IDA & IBRD countries)LatviaLeast developed countries: UN classificationLebanonLiberiaLibyaLithuaniaLow & middle incomeLow incomeLower middle incomeLuxembourgMacao SAR, ChinaMacedonia, FYRMadagascarMalawiMalaysiaMaliMaltaMauritaniaMauritiusMexicoMiddle East & North AfricaMiddle East & North Africa (excluding high income)Middle East & North Africa (IDA & IBRD countries)Middle incomeMoldovaMongoliaMontenegroMoroccoMozambiqueMyanmarNepalNetherlandsNew CaledoniaNew ZealandNicaraguaNigerNigeriaNorth AmericaNorwayOECD membersOmanOther small statesPacific island small statesPakistanPanamaPapua New GuineaParaguayPeruPhilippinesPolandPortugalPost-demographic dividendPre-demographic dividendQatarRomaniaRussian FederationRwandaSamoaSaudi ArabiaSenegalSerbiaSeychellesSierra LeoneSingaporeSlovak RepublicSloveniaSmall statesSomaliaSouth AfricaSouth AsiaSouth Asia (IDA & IBRD)SpainSri LankaSt. LuciaSub-Saharan Africa Sub-Saharan Africa (excluding high income)Sub-Saharan Africa (IDA & IBRD countries)SudanSurinameSwedenSwitzerlandSyrian Arab RepublicTajikistanTanzaniaThailandTogoTrinidad and TobagoTunisiaTurkeyTurkmenistanUgandaUkraineUnited Arab EmiratesUnited KingdomUnited StatesUpper middle incomeUruguayUzbekistanVenezuela, RBVietnamWorldYemen, Rep.ZambiaZimbabwe Timeline:
This timeline shows a graph from 1961 to 2015 of Central Europe and the Baltics. No data until 1960. Number of actual observations by date: 55.
Source name:
World Development Indicators
Source organization:
World Bank staff estimates based data from International Monetary Fund's Direction of Trade database.
Categories, topics:
Private Sector, Trade
Last updated:
apr 23, 2017
Indicators value changes by year
Maximum:
11.864
jan 1, 1983
At the date of observation
Value
Absolute change
Change from previous value
jan 1, 1961
3.899
+3.899
0.0%
jan 1, 1962
4.416
+0.516
13.24%
jan 1, 1963
4.733
+0.317
7.19%
jan 1, 1964
3.243
-1.491
-31.49%
jan 1, 1965
3.242
-0.001
-0.02%
jan 1, 1966
3.693
+0.452
13.93%
jan 1, 1967
4.899
+1.205
32.64%
jan 1, 1968
8.248
+3.349
68.37%
jan 1, 1969
4.398
-3.85
-46.68%
jan 1, 1970
4.464
+0.065
1.48%
jan 1, 1971
3.002
-1.462
-32.75%
jan 1, 1972
2.532
-0.47
-15.66%
jan 1, 1973
2.636
+0.104
4.12%
jan 1, 1974
2.719
+0.084
3.17%
jan 1, 1975
4.168
+1.448
53.26%
jan 1, 1976
5.47
+1.302
31.24%
jan 1, 1977
6.113
+0.644
11.77%
jan 1, 1978
6.113
-0.001
-0.01%
jan 1, 1979
5.683
-0.43
-7.03%
jan 1, 1980
5.52
-0.163
-2.87%
jan 1, 1981
7.155
+1.635
29.62%
jan 1, 1982
11.214
+4.06
56.74%
jan 1, 1983
11.864
+0.65
5.79%
jan 1, 1984
9.977
-1.887
-15.91%
jan 1, 1985
8.529
-1.448
-14.51%
jan 1, 1986
8.528
-0.001
-0.02%
jan 1, 1987
6.496
-2.031
-23.82%
jan 1, 1988
5.828
-0.669
-10.29%
jan 1, 1989
6.542
+0.715
12.27%
jan 1, 1990
5.117
-1.426
-21.79%
jan 1, 1991
4.409
-0.708
-13.83%
jan 1, 1992
4.119
-0.29
-6.58%
jan 1, 1993
4.537
+0.418
10.14%
jan 1, 1994
2.301
-2.236
-49.29%
jan 1, 1995
2.169
-0.132
-5.72%
jan 1, 1996
2.23
+0.061
2.82%
jan 1, 1997
1.925
-0.305
-13.69%
jan 1, 1998
1.617
-0.308
-15.98%
jan 1, 1999
1.3
-0.317
-19.58%
jan 1, 2000
1.101
-0.2
-15.36%
jan 1, 2001
1.014
-0.086
-7.83%
jan 1, 2002
1.044
+0.03
2.95%
jan 1, 2003
0.981
-0.063
-6.04%
jan 1, 2004
0.816
-0.165
-16.85%
jan 1, 2005
0.806
-0.01
-1.17%
jan 1, 2006
0.989
+0.182
22.62%
jan 1, 2007
0.902
-0.087
-8.78%
jan 1, 2008
0.888
-0.014
-1.59%
jan 1, 2009
1.028
+0.141
15.87%
jan 1, 2010
1.195
+0.166
16.18%
jan 1, 2011
0.988
-0.207
-17.34%
jan 1, 2012
0.947
-0.041
-4.13%
jan 1, 2013
1.192
+0.245
25.87%
jan 1, 2014
1.303
+0.111
9.33%
jan 1, 2015
1.404
+0.101
7.77%
Ranking of countries by current statistics by years


Comments: