29
/
en
AIzaSyAYiBZKx7MnpbEhh9jyipgxe19OcubqV5w
April 1, 2024
218630
Panama
PAN
true
2
1
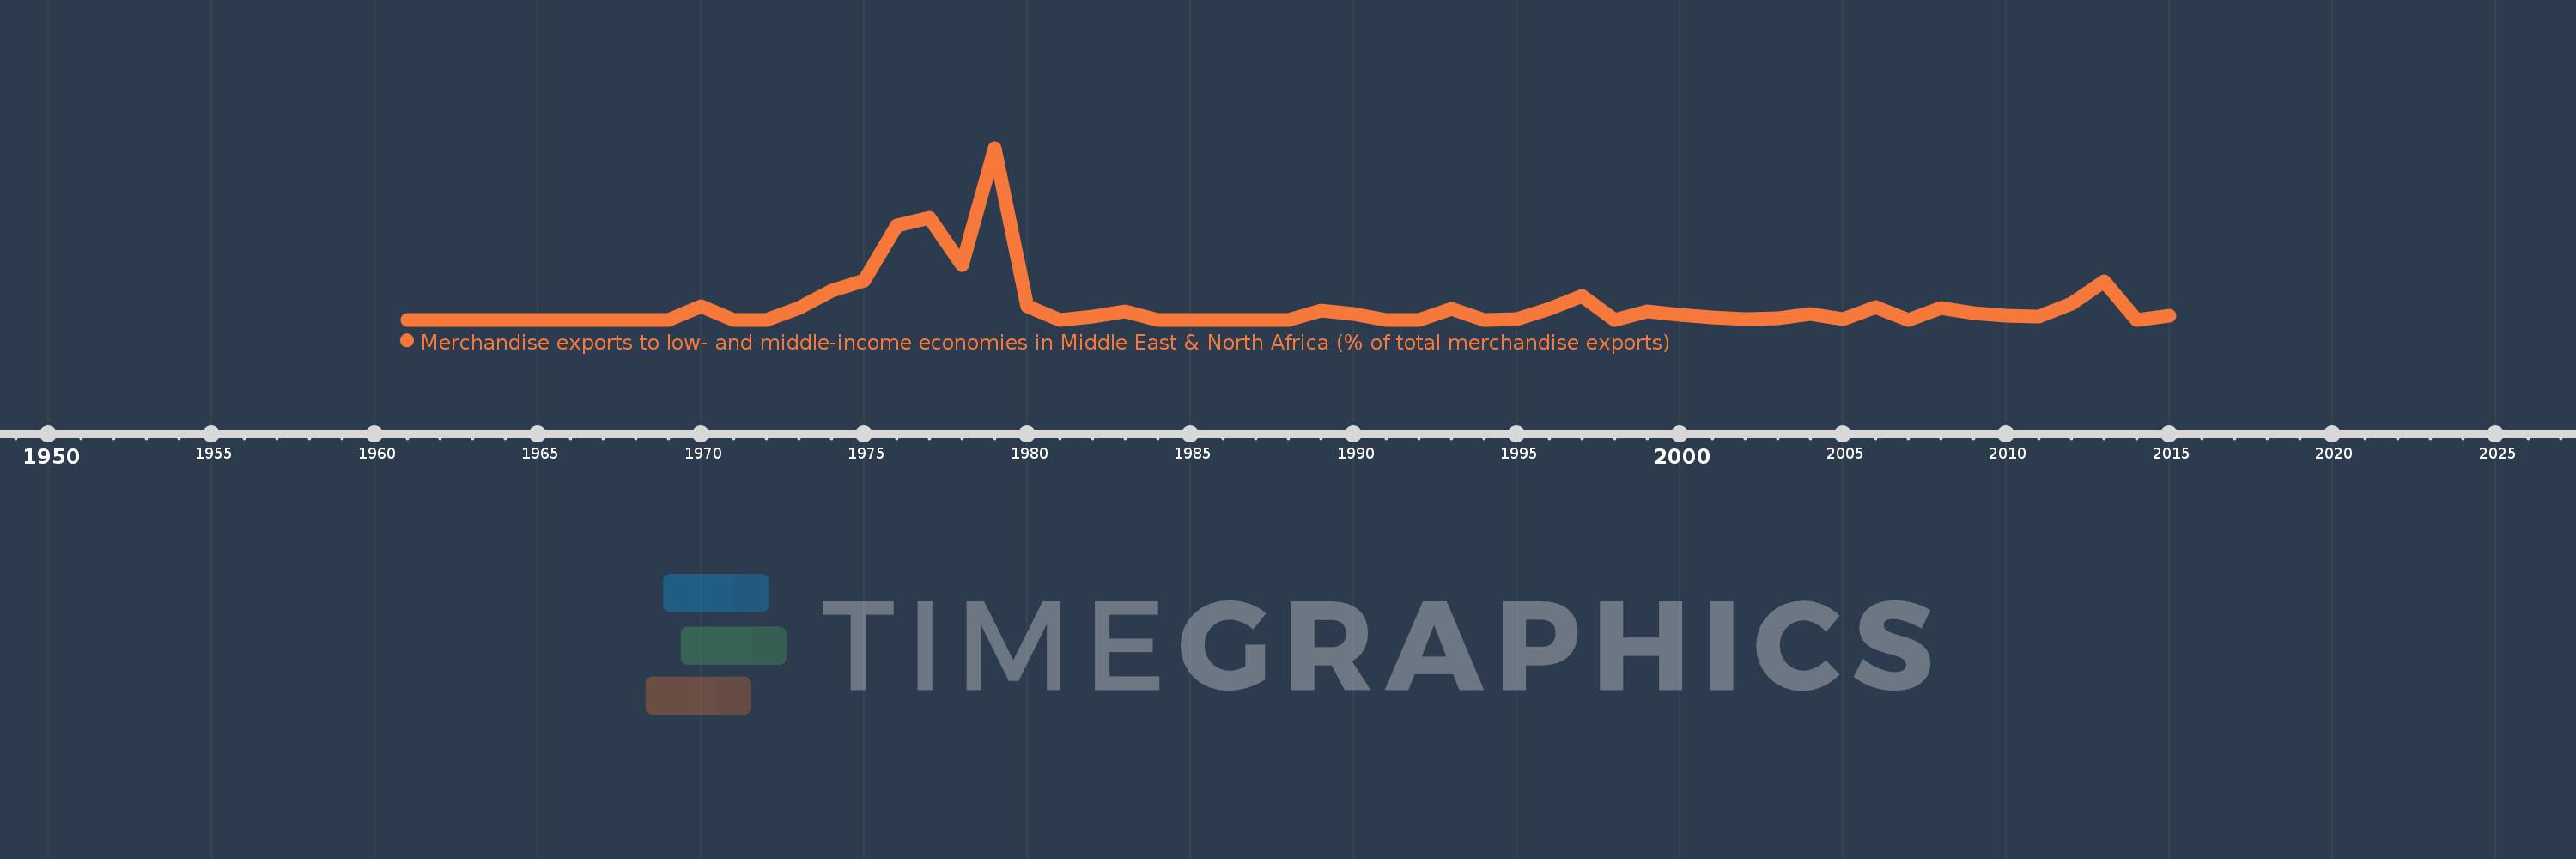
Merchandise exports to low- and middle-income economies in Middle East & North Africa (% of total merchandise exports)
2015,2014,2013,2012,2011,2010,2009,2008,2007,2006,2005,2004,2003,2002,2001,2000,1999,1998,1997,1996,1995,1994,1993,1992,1991,1990,1989,1988,1987,1986,1985,1984,1983,1982,1981,1980,1979,1978,1977,1976,1975,1974,1973,1972,1971,1970,1969,1968,1967,1966,1965,1964,1963,1962,1961
This statistics in other country:
AfghanistanAlbaniaAlgeriaAngolaArab WorldArgentinaArmeniaArubaAustraliaAustriaAzerbaijanBahamas, TheBahrainBangladeshBarbadosBelarusBelgiumBelizeBeninBermudaBoliviaBosnia and HerzegovinaBrazilBrunei DarussalamBulgariaBurkina FasoBurundiCabo VerdeCambodiaCameroonCanadaCaribbean small statesCentral African RepublicCentral Europe and the BalticsChadChileChinaColombiaComorosCongo, Dem. Rep.Congo, Rep.Costa RicaCote d'IvoireCroatiaCubaCyprusCzech RepublicDenmarkDjiboutiDominicaDominican RepublicEarly-demographic dividendEast Asia & PacificEast Asia & Pacific (excluding high income)East Asia & Pacific (IDA & IBRD countries)EcuadorEgypt, Arab Rep.El SalvadorEquatorial GuineaEstoniaEthiopiaEuro areaEurope & Central AsiaEurope & Central Asia (excluding high income)Europe & Central Asia (IDA & IBRD countries)European UnionFijiFinlandFragile and conflict affected situationsFranceGabonGambia, TheGeorgiaGermanyGhanaGreeceGreenlandGrenadaGuatemalaGuineaGuinea-BissauGuyanaHaitiHeavily indebted poor countries (HIPC)High incomeHondurasHong Kong SAR, ChinaHungaryIBRD onlyIcelandIDA & IBRD totalIDA blendIDA onlyIDA totalIndiaIndonesiaIran, Islamic Rep.IraqIrelandIsraelItalyJamaicaJapanJordanKazakhstanKenyaKorea, Dem. People’s Rep.Korea, Rep.KosovoKuwaitKyrgyz RepublicLao PDRLate-demographic dividendLatin America & Caribbean Latin America & Caribbean (excluding high income)Latin America & the Caribbean (IDA & IBRD countries)LatviaLeast developed countries: UN classificationLebanonLiberiaLibyaLithuaniaLow & middle incomeLow incomeLower middle incomeLuxembourgMacao SAR, ChinaMacedonia, FYRMadagascarMalawiMalaysiaMaliMaltaMauritaniaMauritiusMexicoMiddle East & North AfricaMiddle East & North Africa (excluding high income)Middle East & North Africa (IDA & IBRD countries)Middle incomeMoldovaMongoliaMontenegroMoroccoMozambiqueMyanmarNepalNetherlandsNew CaledoniaNew ZealandNicaraguaNigerNigeriaNorth AmericaNorwayOECD membersOmanOther small statesPacific island small statesPakistanPanamaPapua New GuineaParaguayPeruPhilippinesPolandPortugalPost-demographic dividendPre-demographic dividendQatarRomaniaRussian FederationRwandaSamoaSaudi ArabiaSenegalSerbiaSeychellesSierra LeoneSingaporeSlovak RepublicSloveniaSmall statesSomaliaSouth AfricaSouth AsiaSouth Asia (IDA & IBRD)SpainSri LankaSt. LuciaSub-Saharan Africa Sub-Saharan Africa (excluding high income)Sub-Saharan Africa (IDA & IBRD countries)SudanSurinameSwedenSwitzerlandSyrian Arab RepublicTajikistanTanzaniaThailandTogoTrinidad and TobagoTunisiaTurkeyTurkmenistanUgandaUkraineUnited Arab EmiratesUnited KingdomUnited StatesUpper middle incomeUruguayUzbekistanVenezuela, RBVietnamWorldYemen, Rep.ZambiaZimbabwe Timeline:
This timeline shows a graph from 1961 to 2015 of Panama. No data until 1960. Number of actual observations by date: 55.
Source name:
World Development Indicators
Source organization:
World Bank staff estimates based data from International Monetary Fund's Direction of Trade database.
Categories, topics:
Private Sector, Trade
Last updated:
apr 23, 2017
Indicators value changes by year
At the date of observation
Value
Absolute change
Change from previous value
jan 1, 1970
0.156
+0.156
%
jan 1, 1971
0.0
-0.156
-100.0%
jan 1, 1973
0.139
+0.139
%
jan 1, 1974
0.342
+0.203
146.51%
jan 1, 1975
0.462
+0.12
35.1%
jan 1, 1976
1.113
+0.651
141.1%
jan 1, 1977
1.204
+0.091
8.2%
jan 1, 1978
0.646
-0.558
-46.36%
jan 1, 1979
2.023
+1.377
213.21%
jan 1, 1980
0.156
-1.867
-92.27%
jan 1, 1981
0.0
-0.156
-100.0%
jan 1, 1982
0.035
+0.035
%
jan 1, 1983
0.101
+0.066
188.85%
jan 1, 1984
0.0
-0.101
-100.0%
jan 1, 1989
0.108
+0.108
%
jan 1, 1990
0.064
-0.044
-40.9%
jan 1, 1991
0.0
-0.064
-100.0%
jan 1, 1992
0.002
+0.002
%
jan 1, 1993
0.131
+0.129
5.88K%
jan 1, 1994
0.0
-0.131
-100.0%
jan 1, 1995
0.003
+0.003
%
jan 1, 1996
0.128
+0.125
4.12K%
jan 1, 1997
0.276
+0.149
116.41%
jan 1, 1998
0.0
-0.276
-100.0%
jan 1, 1999
0.098
+0.098
%
jan 1, 2000
0.054
-0.044
-44.9%
jan 1, 2001
0.027
-0.027
-50.64%
jan 1, 2002
0.01
-0.016
-61.24%
jan 1, 2003
0.022
+0.012
117.08%
jan 1, 2004
0.07
+0.047
210.23%
jan 1, 2005
0.008
-0.062
-88.8%
jan 1, 2006
0.152
+0.145
1.85K%
jan 1, 2007
0.0
-0.152
-100.0%
jan 1, 2008
0.137
+0.137
%
jan 1, 2009
0.076
-0.062
-44.96%
jan 1, 2010
0.051
-0.025
-32.93%
jan 1, 2011
0.042
-0.009
-16.84%
jan 1, 2012
0.187
+0.145
344.59%
jan 1, 2013
0.455
+0.268
142.75%
jan 1, 2014
0.0
-0.455
-100.0%
jan 1, 2015
0.047
+0.047
%
Ranking of countries by current statistics by years


Comments: