29
/
en
AIzaSyAYiBZKx7MnpbEhh9jyipgxe19OcubqV5w
April 1, 2024
156277
Indonesia
IDN
true
2
1
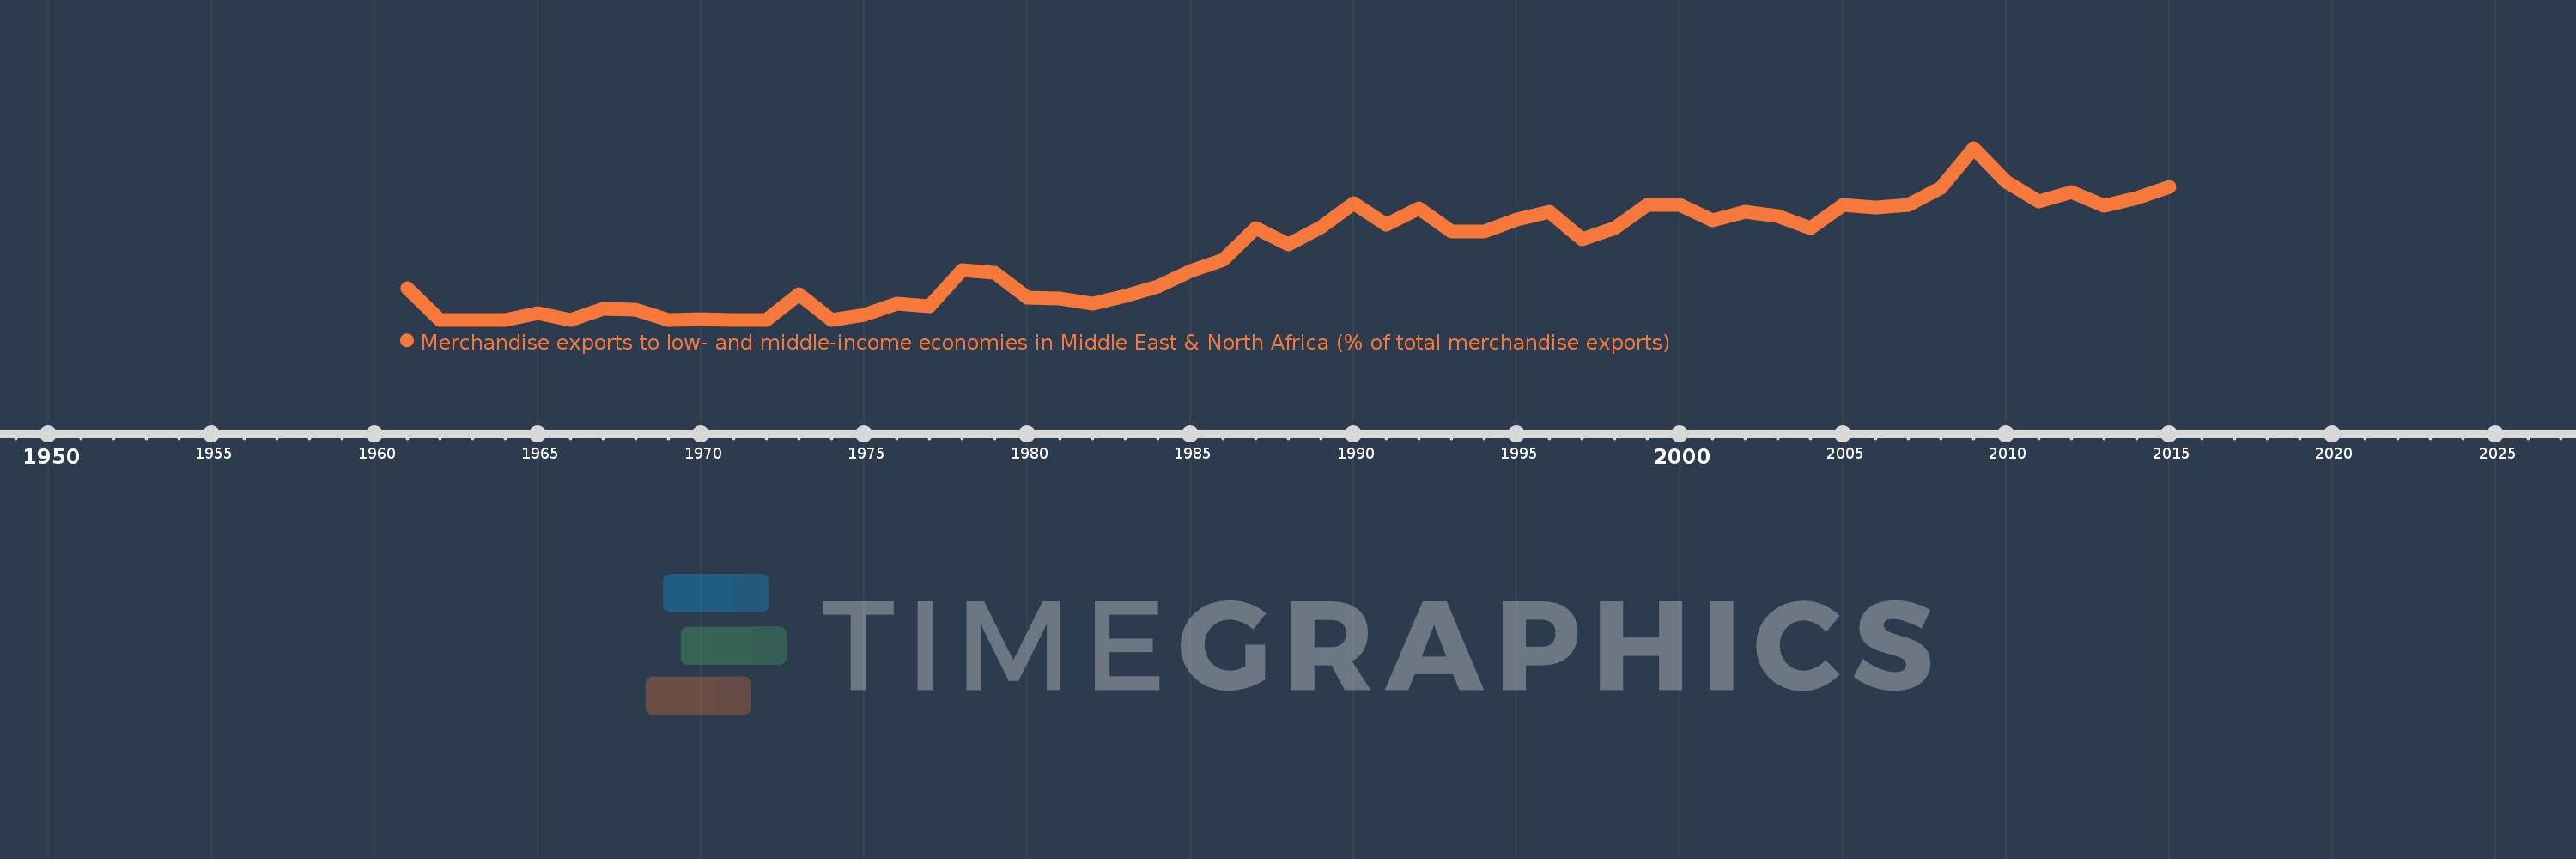
Merchandise exports to low- and middle-income economies in Middle East & North Africa (% of total merchandise exports)
2015,2014,2013,2012,2011,2010,2009,2008,2007,2006,2005,2004,2003,2002,2001,2000,1999,1998,1997,1996,1995,1994,1993,1992,1991,1990,1989,1988,1987,1986,1985,1984,1983,1982,1981,1980,1979,1978,1977,1976,1975,1974,1973,1972,1971,1970,1969,1968,1967,1966,1965,1964,1963,1962,1961
This statistics in other country:
AfghanistanAlbaniaAlgeriaAngolaArab WorldArgentinaArmeniaArubaAustraliaAustriaAzerbaijanBahamas, TheBahrainBangladeshBarbadosBelarusBelgiumBelizeBeninBermudaBoliviaBosnia and HerzegovinaBrazilBrunei DarussalamBulgariaBurkina FasoBurundiCabo VerdeCambodiaCameroonCanadaCaribbean small statesCentral African RepublicCentral Europe and the BalticsChadChileChinaColombiaComorosCongo, Dem. Rep.Congo, Rep.Costa RicaCote d'IvoireCroatiaCubaCyprusCzech RepublicDenmarkDjiboutiDominicaDominican RepublicEarly-demographic dividendEast Asia & PacificEast Asia & Pacific (excluding high income)East Asia & Pacific (IDA & IBRD countries)EcuadorEgypt, Arab Rep.El SalvadorEquatorial GuineaEstoniaEthiopiaEuro areaEurope & Central AsiaEurope & Central Asia (excluding high income)Europe & Central Asia (IDA & IBRD countries)European UnionFijiFinlandFragile and conflict affected situationsFranceGabonGambia, TheGeorgiaGermanyGhanaGreeceGreenlandGrenadaGuatemalaGuineaGuinea-BissauGuyanaHaitiHeavily indebted poor countries (HIPC)High incomeHondurasHong Kong SAR, ChinaHungaryIBRD onlyIcelandIDA & IBRD totalIDA blendIDA onlyIDA totalIndiaIndonesiaIran, Islamic Rep.IraqIrelandIsraelItalyJamaicaJapanJordanKazakhstanKenyaKorea, Dem. People’s Rep.Korea, Rep.KosovoKuwaitKyrgyz RepublicLao PDRLate-demographic dividendLatin America & Caribbean Latin America & Caribbean (excluding high income)Latin America & the Caribbean (IDA & IBRD countries)LatviaLeast developed countries: UN classificationLebanonLiberiaLibyaLithuaniaLow & middle incomeLow incomeLower middle incomeLuxembourgMacao SAR, ChinaMacedonia, FYRMadagascarMalawiMalaysiaMaliMaltaMauritaniaMauritiusMexicoMiddle East & North AfricaMiddle East & North Africa (excluding high income)Middle East & North Africa (IDA & IBRD countries)Middle incomeMoldovaMongoliaMontenegroMoroccoMozambiqueMyanmarNepalNetherlandsNew CaledoniaNew ZealandNicaraguaNigerNigeriaNorth AmericaNorwayOECD membersOmanOther small statesPacific island small statesPakistanPanamaPapua New GuineaParaguayPeruPhilippinesPolandPortugalPost-demographic dividendPre-demographic dividendQatarRomaniaRussian FederationRwandaSamoaSaudi ArabiaSenegalSerbiaSeychellesSierra LeoneSingaporeSlovak RepublicSloveniaSmall statesSomaliaSouth AfricaSouth AsiaSouth Asia (IDA & IBRD)SpainSri LankaSt. LuciaSub-Saharan Africa Sub-Saharan Africa (excluding high income)Sub-Saharan Africa (IDA & IBRD countries)SudanSurinameSwedenSwitzerlandSyrian Arab RepublicTajikistanTanzaniaThailandTogoTrinidad and TobagoTunisiaTurkeyTurkmenistanUgandaUkraineUnited Arab EmiratesUnited KingdomUnited StatesUpper middle incomeUruguayUzbekistanVenezuela, RBVietnamWorldYemen, Rep.ZambiaZimbabwe Timeline:
This timeline shows a graph from 1961 to 2015 of Indonesia. No data until 1960. Number of actual observations by date: 55.
Source name:
World Development Indicators
Source organization:
World Bank staff estimates based data from International Monetary Fund's Direction of Trade database.
Categories, topics:
Private Sector, Trade
Last updated:
apr 23, 2017
Indicators value changes by year
At the date of observation
Value
Absolute change
Change from previous value
jan 1, 1961
0.395
+0.395
0.0%
jan 1, 1962
0.0
-0.395
-100.0%
jan 1, 1965
0.085
+0.085
%
jan 1, 1966
0.0
-0.085
-100.0%
jan 1, 1967
0.136
+0.136
%
jan 1, 1968
0.122
-0.014
-10.02%
jan 1, 1969
0.0
-0.122
-100.0%
jan 1, 1970
0.012
+0.012
%
jan 1, 1971
0.0
-0.012
-100.0%
jan 1, 1973
0.322
+0.322
%
jan 1, 1974
0.0
-0.322
-100.0%
jan 1, 1975
0.065
+0.065
%
jan 1, 1976
0.196
+0.131
202.75%
jan 1, 1977
0.168
-0.027
-13.91%
jan 1, 1978
0.625
+0.457
271.0%
jan 1, 1979
0.588
-0.037
-5.88%
jan 1, 1980
0.275
-0.314
-53.3%
jan 1, 1981
0.266
-0.009
-3.17%
jan 1, 1982
0.199
-0.067
-25.32%
jan 1, 1983
0.297
+0.099
49.75%
jan 1, 1984
0.418
+0.12
40.36%
jan 1, 1985
0.609
+0.191
45.8%
jan 1, 1986
0.748
+0.139
22.83%
jan 1, 1987
1.143
+0.395
52.79%
jan 1, 1988
0.939
-0.203
-17.81%
jan 1, 1989
1.159
+0.22
23.43%
jan 1, 1990
1.462
+0.303
26.11%
jan 1, 1991
1.187
-0.274
-18.77%
jan 1, 1992
1.397
+0.21
17.65%
jan 1, 1993
1.108
-0.289
-20.68%
jan 1, 1994
1.102
-0.006
-0.54%
jan 1, 1995
1.259
+0.157
14.25%
jan 1, 1996
1.352
+0.093
7.39%
jan 1, 1997
1.01
-0.342
-25.3%
jan 1, 1998
1.147
+0.137
13.56%
jan 1, 1999
1.441
+0.294
25.6%
jan 1, 2000
1.443
+0.003
0.18%
jan 1, 2001
1.242
-0.201
-13.96%
jan 1, 2002
1.352
+0.11
8.89%
jan 1, 2003
1.304
-0.049
-3.59%
jan 1, 2004
1.148
-0.156
-11.93%
jan 1, 2005
1.441
+0.292
25.46%
jan 1, 2006
1.409
-0.031
-2.18%
jan 1, 2007
1.434
+0.025
1.78%
jan 1, 2008
1.651
+0.217
15.11%
jan 1, 2009
2.152
+0.501
30.33%
jan 1, 2010
1.73
-0.421
-19.58%
jan 1, 2011
1.477
-0.253
-14.65%
jan 1, 2012
1.596
+0.119
8.04%
jan 1, 2013
1.433
-0.163
-10.2%
jan 1, 2014
1.52
+0.087
6.08%
jan 1, 2015
1.665
+0.145
9.54%
Ranking of countries by current statistics by years


Comments: