29
/
en
AIzaSyAYiBZKx7MnpbEhh9jyipgxe19OcubqV5w
April 1, 2024
145931
Guinea
GIN
true
2
1
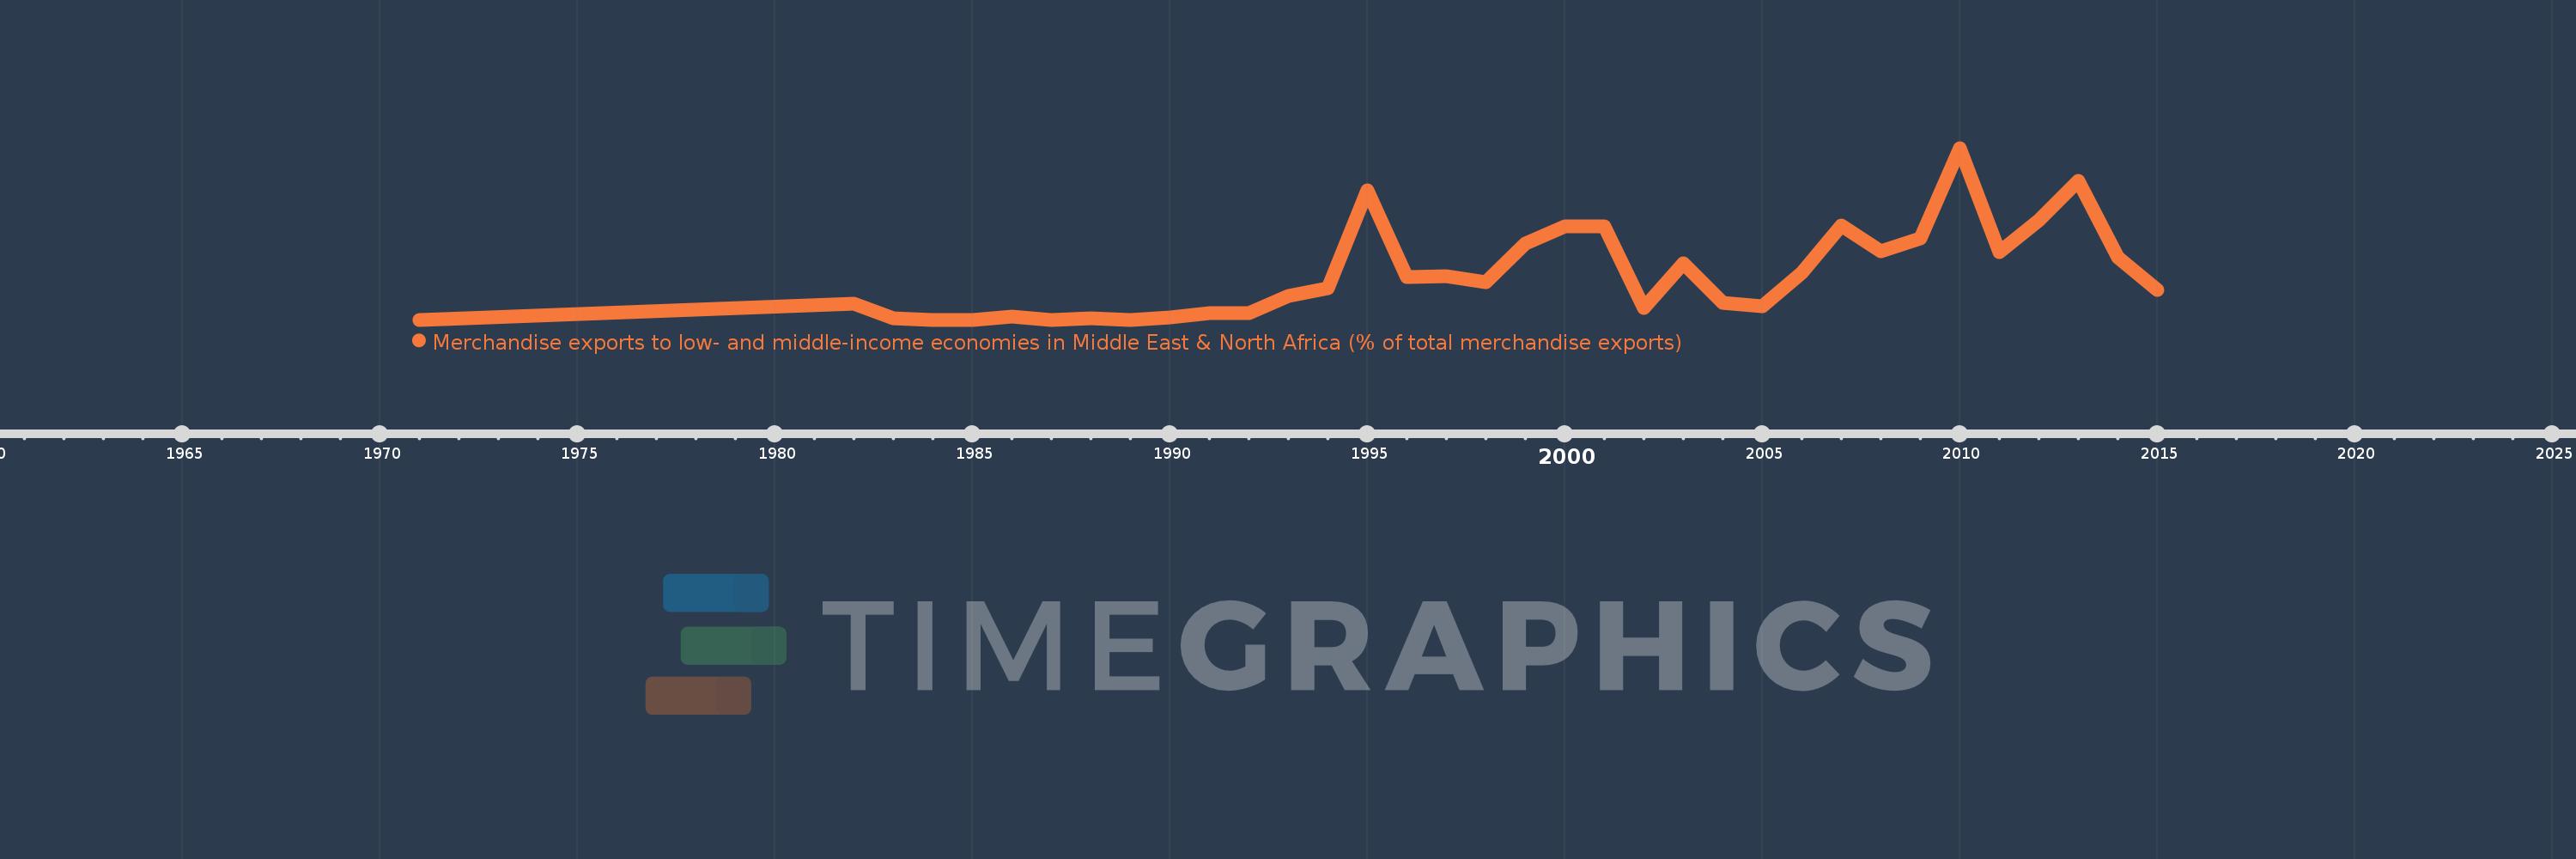
Merchandise exports to low- and middle-income economies in Middle East & North Africa (% of total merchandise exports)
2015,2014,2013,2012,2011,2010,2009,2008,2007,2006,2005,2004,2003,2002,2001,2000,1999,1998,1997,1996,1995,1994,1993,1992,1991,1990,1989,1988,1987,1986,1985,1984,1983,1982,1971
This statistics in other country:
AfghanistanAlbaniaAlgeriaAngolaArab WorldArgentinaArmeniaArubaAustraliaAustriaAzerbaijanBahamas, TheBahrainBangladeshBarbadosBelarusBelgiumBelizeBeninBermudaBoliviaBosnia and HerzegovinaBrazilBrunei DarussalamBulgariaBurkina FasoBurundiCabo VerdeCambodiaCameroonCanadaCaribbean small statesCentral African RepublicCentral Europe and the BalticsChadChileChinaColombiaComorosCongo, Dem. Rep.Congo, Rep.Costa RicaCote d'IvoireCroatiaCubaCyprusCzech RepublicDenmarkDjiboutiDominicaDominican RepublicEarly-demographic dividendEast Asia & PacificEast Asia & Pacific (excluding high income)East Asia & Pacific (IDA & IBRD countries)EcuadorEgypt, Arab Rep.El SalvadorEquatorial GuineaEstoniaEthiopiaEuro areaEurope & Central AsiaEurope & Central Asia (excluding high income)Europe & Central Asia (IDA & IBRD countries)European UnionFijiFinlandFragile and conflict affected situationsFranceGabonGambia, TheGeorgiaGermanyGhanaGreeceGreenlandGrenadaGuatemalaGuineaGuinea-BissauGuyanaHaitiHeavily indebted poor countries (HIPC)High incomeHondurasHong Kong SAR, ChinaHungaryIBRD onlyIcelandIDA & IBRD totalIDA blendIDA onlyIDA totalIndiaIndonesiaIran, Islamic Rep.IraqIrelandIsraelItalyJamaicaJapanJordanKazakhstanKenyaKorea, Dem. People’s Rep.Korea, Rep.KosovoKuwaitKyrgyz RepublicLao PDRLate-demographic dividendLatin America & Caribbean Latin America & Caribbean (excluding high income)Latin America & the Caribbean (IDA & IBRD countries)LatviaLeast developed countries: UN classificationLebanonLiberiaLibyaLithuaniaLow & middle incomeLow incomeLower middle incomeLuxembourgMacao SAR, ChinaMacedonia, FYRMadagascarMalawiMalaysiaMaliMaltaMauritaniaMauritiusMexicoMiddle East & North AfricaMiddle East & North Africa (excluding high income)Middle East & North Africa (IDA & IBRD countries)Middle incomeMoldovaMongoliaMontenegroMoroccoMozambiqueMyanmarNepalNetherlandsNew CaledoniaNew ZealandNicaraguaNigerNigeriaNorth AmericaNorwayOECD membersOmanOther small statesPacific island small statesPakistanPanamaPapua New GuineaParaguayPeruPhilippinesPolandPortugalPost-demographic dividendPre-demographic dividendQatarRomaniaRussian FederationRwandaSamoaSaudi ArabiaSenegalSerbiaSeychellesSierra LeoneSingaporeSlovak RepublicSloveniaSmall statesSomaliaSouth AfricaSouth AsiaSouth Asia (IDA & IBRD)SpainSri LankaSt. LuciaSub-Saharan Africa Sub-Saharan Africa (excluding high income)Sub-Saharan Africa (IDA & IBRD countries)SudanSurinameSwedenSwitzerlandSyrian Arab RepublicTajikistanTanzaniaThailandTogoTrinidad and TobagoTunisiaTurkeyTurkmenistanUgandaUkraineUnited Arab EmiratesUnited KingdomUnited StatesUpper middle incomeUruguayUzbekistanVenezuela, RBVietnamWorldYemen, Rep.ZambiaZimbabwe Timeline:
This timeline shows a graph from 1971 to 2015 of Guinea. No data until 1970. Number of actual observations by date: 35.
Source name:
World Development Indicators
Source organization:
World Bank staff estimates based data from International Monetary Fund's Direction of Trade database.
Categories, topics:
Private Sector, Trade
Last updated:
apr 23, 2017
Indicators value changes by year
At the date of observation
Value
Absolute change
Change from previous value
jan 1, 1982
0.202
+0.202
%
jan 1, 1983
0.014
-0.188
-93.09%
jan 1, 1984
0.0
-0.014
-100.0%
jan 1, 1985
0.001
+0.001
%
jan 1, 1986
0.036
+0.036
6.08K%
jan 1, 1987
0.0
-0.036
-100.0%
jan 1, 1988
0.019
+0.019
%
jan 1, 1989
0.0
-0.019
-98.99%
jan 1, 1990
0.025
+0.025
12.8K%
jan 1, 1991
0.077
+0.051
204.48%
jan 1, 1992
0.079
+0.002
3.2%
jan 1, 1993
0.296
+0.217
274.23%
jan 1, 1994
0.392
+0.097
32.67%
jan 1, 1995
1.595
+1.203
306.87%
jan 1, 1996
0.526
-1.069
-67.02%
jan 1, 1997
0.531
+0.005
0.89%
jan 1, 1998
0.456
-0.075
-14.04%
jan 1, 1999
0.937
+0.481
105.37%
jan 1, 2000
1.148
+0.211
22.47%
jan 1, 2001
1.147
-0.001
-0.05%
jan 1, 2002
0.146
-1.001
-87.24%
jan 1, 2003
0.691
+0.545
372.25%
jan 1, 2004
0.205
-0.486
-70.32%
jan 1, 2005
0.166
-0.039
-18.93%
jan 1, 2006
0.581
+0.414
249.19%
jan 1, 2007
1.156
+0.576
99.12%
jan 1, 2008
0.84
-0.316
-27.34%
jan 1, 2009
1.003
+0.163
19.4%
jan 1, 2010
2.11
+1.107
110.33%
jan 1, 2011
0.827
-1.283
-60.82%
jan 1, 2012
1.218
+0.391
47.32%
jan 1, 2013
1.707
+0.489
40.18%
jan 1, 2014
0.772
-0.935
-54.76%
jan 1, 2015
0.37
-0.403
-52.13%
Ranking of countries by current statistics by years


Comments: