29
/
en
AIzaSyAYiBZKx7MnpbEhh9jyipgxe19OcubqV5w
April 1, 2024
62790
World
WLD
false
2
1
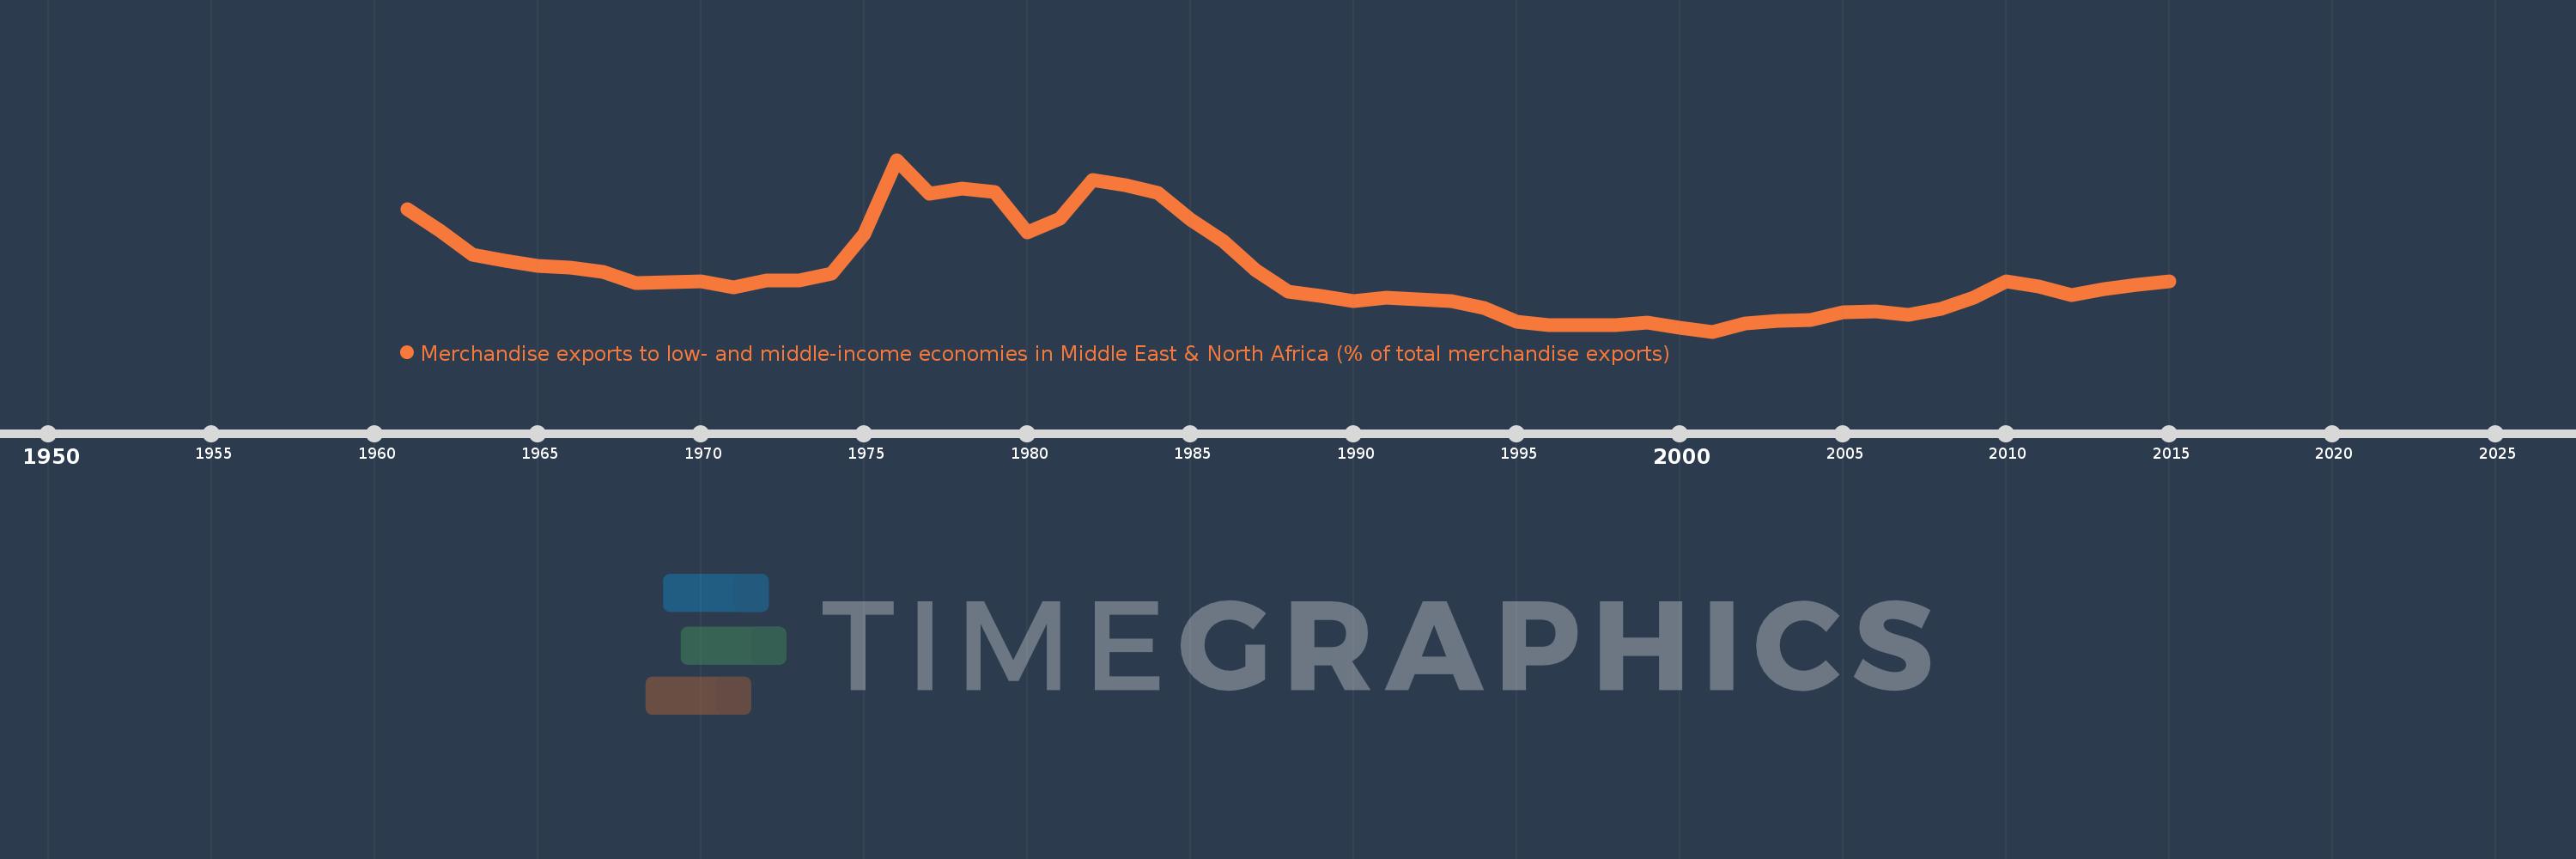
Merchandise exports to low- and middle-income economies in Middle East & North Africa (% of total merchandise exports)
2015,2014,2013,2012,2011,2010,2009,2008,2007,2006,2005,2004,2003,2002,2001,2000,1999,1998,1997,1996,1995,1994,1993,1992,1991,1990,1989,1988,1987,1986,1985,1984,1983,1982,1981,1980,1979,1978,1977,1976,1975,1974,1973,1972,1971,1970,1969,1968,1967,1966,1965,1964,1963,1962,1961
Global statistics library →World →Merchandise exports to low- and middle-income economies in Middle East & North Africa (% of total merchandise exports)
This statistics in other country:
AfghanistanAlbaniaAlgeriaAngolaArab WorldArgentinaArmeniaArubaAustraliaAustriaAzerbaijanBahamas, TheBahrainBangladeshBarbadosBelarusBelgiumBelizeBeninBermudaBoliviaBosnia and HerzegovinaBrazilBrunei DarussalamBulgariaBurkina FasoBurundiCabo VerdeCambodiaCameroonCanadaCaribbean small statesCentral African RepublicCentral Europe and the BalticsChadChileChinaColombiaComorosCongo, Dem. Rep.Congo, Rep.Costa RicaCote d'IvoireCroatiaCubaCyprusCzech RepublicDenmarkDjiboutiDominicaDominican RepublicEarly-demographic dividendEast Asia & PacificEast Asia & Pacific (excluding high income)East Asia & Pacific (IDA & IBRD countries)EcuadorEgypt, Arab Rep.El SalvadorEquatorial GuineaEstoniaEthiopiaEuro areaEurope & Central AsiaEurope & Central Asia (excluding high income)Europe & Central Asia (IDA & IBRD countries)European UnionFijiFinlandFragile and conflict affected situationsFranceGabonGambia, TheGeorgiaGermanyGhanaGreeceGreenlandGrenadaGuatemalaGuineaGuinea-BissauGuyanaHaitiHeavily indebted poor countries (HIPC)High incomeHondurasHong Kong SAR, ChinaHungaryIBRD onlyIcelandIDA & IBRD totalIDA blendIDA onlyIDA totalIndiaIndonesiaIran, Islamic Rep.IraqIrelandIsraelItalyJamaicaJapanJordanKazakhstanKenyaKorea, Dem. People’s Rep.Korea, Rep.KosovoKuwaitKyrgyz RepublicLao PDRLate-demographic dividendLatin America & Caribbean Latin America & Caribbean (excluding high income)Latin America & the Caribbean (IDA & IBRD countries)LatviaLeast developed countries: UN classificationLebanonLiberiaLibyaLithuaniaLow & middle incomeLow incomeLower middle incomeLuxembourgMacao SAR, ChinaMacedonia, FYRMadagascarMalawiMalaysiaMaliMaltaMauritaniaMauritiusMexicoMiddle East & North AfricaMiddle East & North Africa (excluding high income)Middle East & North Africa (IDA & IBRD countries)Middle incomeMoldovaMongoliaMontenegroMoroccoMozambiqueMyanmarNepalNetherlandsNew CaledoniaNew ZealandNicaraguaNigerNigeriaNorth AmericaNorwayOECD membersOmanOther small statesPacific island small statesPakistanPanamaPapua New GuineaParaguayPeruPhilippinesPolandPortugalPost-demographic dividendPre-demographic dividendQatarRomaniaRussian FederationRwandaSamoaSaudi ArabiaSenegalSerbiaSeychellesSierra LeoneSingaporeSlovak RepublicSloveniaSmall statesSomaliaSouth AfricaSouth AsiaSouth Asia (IDA & IBRD)SpainSri LankaSt. LuciaSub-Saharan Africa Sub-Saharan Africa (excluding high income)Sub-Saharan Africa (IDA & IBRD countries)SudanSurinameSwedenSwitzerlandSyrian Arab RepublicTajikistanTanzaniaThailandTogoTrinidad and TobagoTunisiaTurkeyTurkmenistanUgandaUkraineUnited Arab EmiratesUnited KingdomUnited StatesUpper middle incomeUruguayUzbekistanVenezuela, RBVietnamWorldYemen, Rep.ZambiaZimbabwe Timeline:
This timeline shows a graph from 1961 to 2015 of World. No data until 1960. Number of actual observations by date: 55.
Source name:
World Development Indicators
Source organization:
World Bank staff estimates based data from International Monetary Fund's Direction of Trade database.
Categories, topics:
Private Sector, Trade
Last updated:
apr 23, 2017
Indicators value changes by year
At the date of observation
Value
Absolute change
Change from previous value
jan 1, 1961
3.941
+3.941
0.0%
jan 1, 1962
3.489
-0.452
-11.47%
jan 1, 1963
2.972
-0.517
-14.82%
jan 1, 1964
2.849
-0.123
-4.15%
jan 1, 1965
2.726
-0.123
-4.31%
jan 1, 1966
2.691
-0.035
-1.29%
jan 1, 1967
2.604
-0.087
-3.23%
jan 1, 1968
2.369
-0.236
-9.05%
jan 1, 1969
2.391
+0.023
0.95%
jan 1, 1970
2.411
+0.02
0.84%
jan 1, 1971
2.265
-0.147
-6.08%
jan 1, 1972
2.419
+0.155
6.83%
jan 1, 1973
2.427
+0.007
0.3%
jan 1, 1974
2.574
+0.148
6.09%
jan 1, 1975
3.409
+0.835
32.42%
jan 1, 1976
5.006
+1.597
46.86%
jan 1, 1977
4.282
-0.724
-14.47%
jan 1, 1978
4.381
+0.098
2.3%
jan 1, 1979
4.321
-0.06
-1.37%
jan 1, 1980
3.46
-0.861
-19.93%
jan 1, 1981
3.754
+0.295
8.52%
jan 1, 1982
4.575
+0.821
21.85%
jan 1, 1983
4.458
-0.117
-2.56%
jan 1, 1984
4.299
-0.159
-3.57%
jan 1, 1985
3.727
-0.572
-13.31%
jan 1, 1986
3.263
-0.464
-12.45%
jan 1, 1987
2.639
-0.623
-19.11%
jan 1, 1988
2.181
-0.458
-17.36%
jan 1, 1989
2.083
-0.099
-4.52%
jan 1, 1990
1.974
-0.109
-5.23%
jan 1, 1991
2.056
+0.082
4.15%
jan 1, 1992
2.015
-0.041
-1.99%
jan 1, 1993
1.988
-0.026
-1.3%
jan 1, 1994
1.832
-0.156
-7.85%
jan 1, 1995
1.546
-0.286
-15.64%
jan 1, 1996
1.463
-0.083
-5.38%
jan 1, 1997
1.457
-0.005
-0.36%
jan 1, 1998
1.463
+0.006
0.4%
jan 1, 1999
1.511
+0.048
3.3%
jan 1, 2000
1.404
-0.108
-7.12%
jan 1, 2001
1.326
-0.078
-5.57%
jan 1, 2002
1.51
+0.185
13.95%
jan 1, 2003
1.563
+0.052
3.47%
jan 1, 2004
1.568
+0.005
0.33%
jan 1, 2005
1.747
+0.179
11.39%
jan 1, 2006
1.759
+0.013
0.72%
jan 1, 2007
1.694
-0.066
-3.73%
jan 1, 2008
1.818
+0.124
7.35%
jan 1, 2009
2.06
+0.242
13.3%
jan 1, 2010
2.397
+0.337
16.36%
jan 1, 2011
2.289
-0.108
-4.49%
jan 1, 2012
2.106
-0.183
-7.99%
jan 1, 2013
2.244
+0.138
6.54%
jan 1, 2014
2.327
+0.082
3.67%
jan 1, 2015
2.4
+0.074
3.17%
Ranking of countries by current statistics by years


Comments: