29
/
en
AIzaSyAYiBZKx7MnpbEhh9jyipgxe19OcubqV5w
April 1, 2024
247807
Spain
ESP
true
2
1
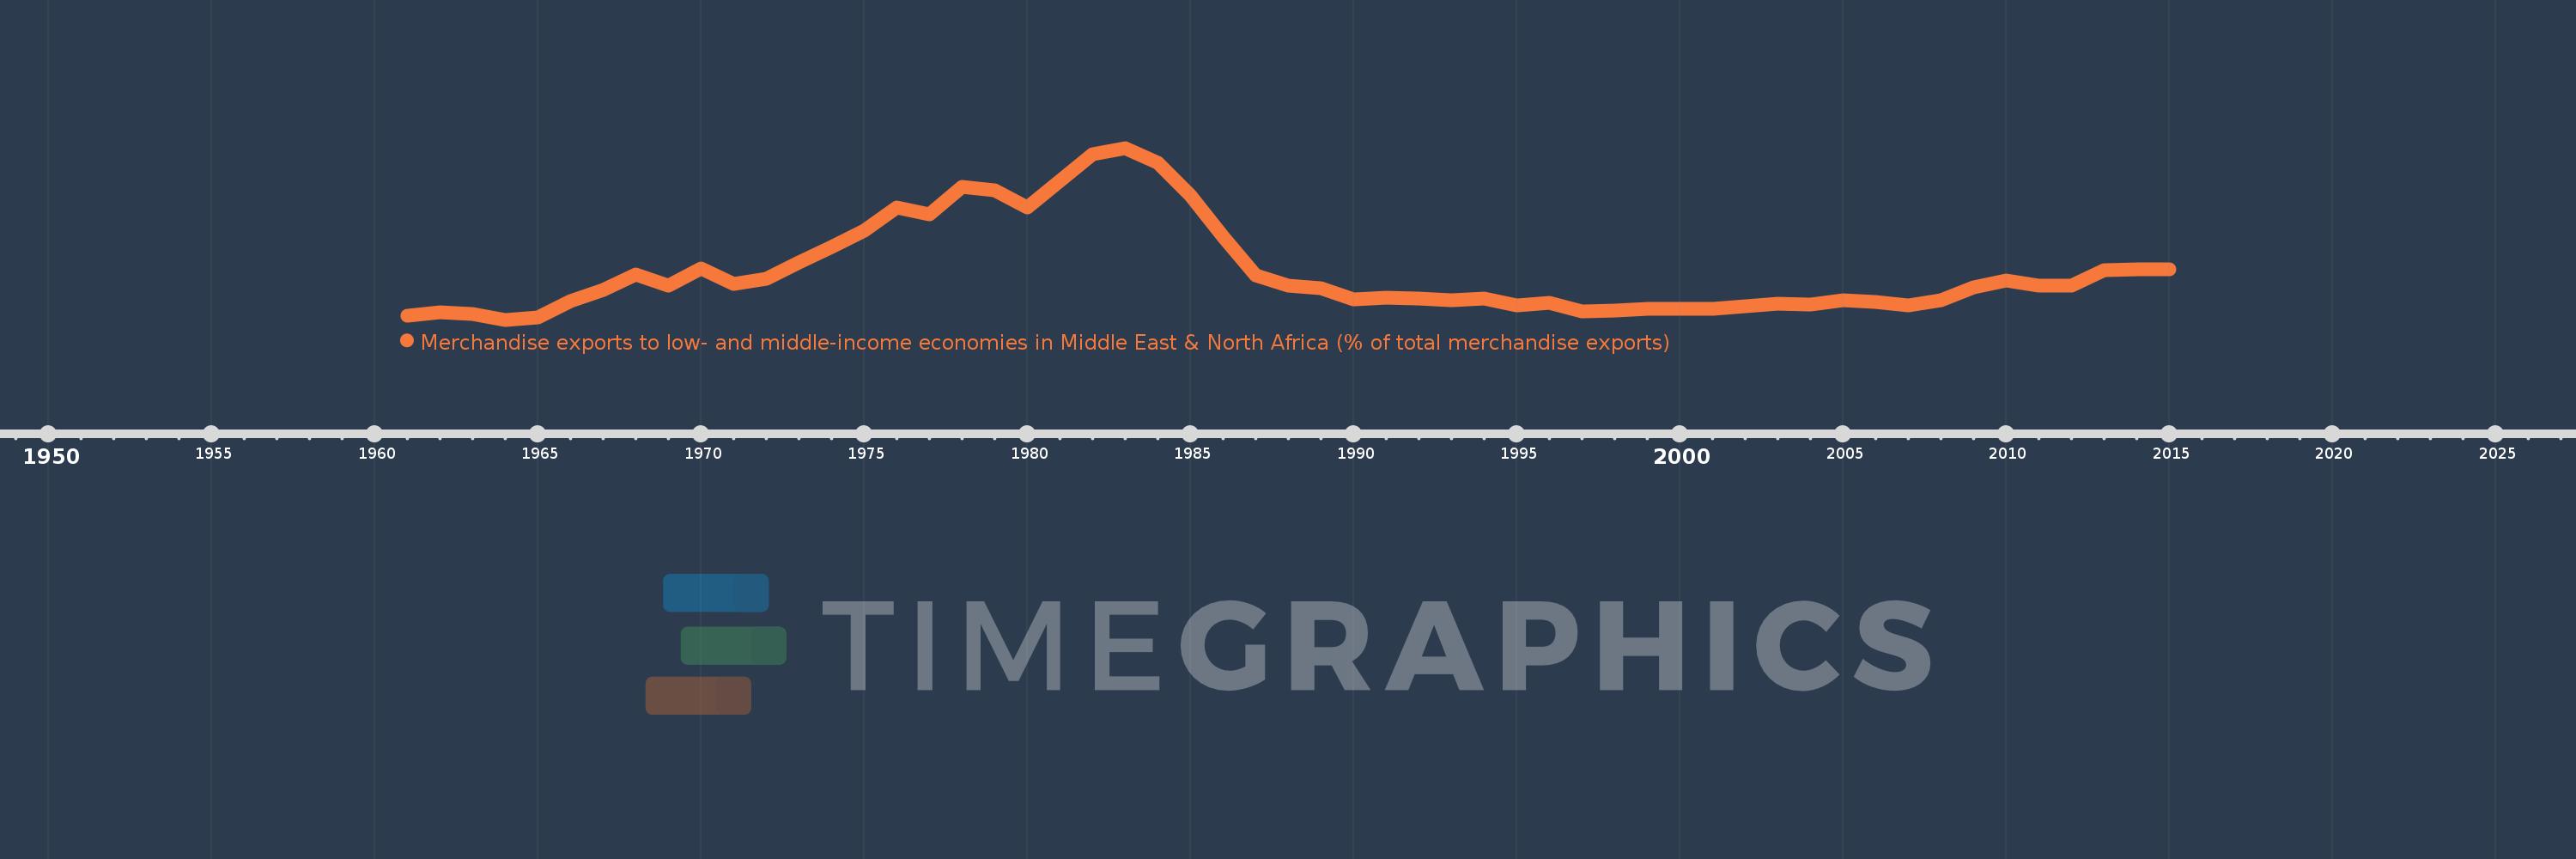
Merchandise exports to low- and middle-income economies in Middle East & North Africa (% of total merchandise exports)
2015,2014,2013,2012,2011,2010,2009,2008,2007,2006,2005,2004,2003,2002,2001,2000,1999,1998,1997,1996,1995,1994,1993,1992,1991,1990,1989,1988,1987,1986,1985,1984,1983,1982,1981,1980,1979,1978,1977,1976,1975,1974,1973,1972,1971,1970,1969,1968,1967,1966,1965,1964,1963,1962,1961
Global statistics library →Spain →Merchandise exports to low- and middle-income economies in Middle East & North Africa (% of total merchandise exports)
This statistics in other country:
AfghanistanAlbaniaAlgeriaAngolaArab WorldArgentinaArmeniaArubaAustraliaAustriaAzerbaijanBahamas, TheBahrainBangladeshBarbadosBelarusBelgiumBelizeBeninBermudaBoliviaBosnia and HerzegovinaBrazilBrunei DarussalamBulgariaBurkina FasoBurundiCabo VerdeCambodiaCameroonCanadaCaribbean small statesCentral African RepublicCentral Europe and the BalticsChadChileChinaColombiaComorosCongo, Dem. Rep.Congo, Rep.Costa RicaCote d'IvoireCroatiaCubaCyprusCzech RepublicDenmarkDjiboutiDominicaDominican RepublicEarly-demographic dividendEast Asia & PacificEast Asia & Pacific (excluding high income)East Asia & Pacific (IDA & IBRD countries)EcuadorEgypt, Arab Rep.El SalvadorEquatorial GuineaEstoniaEthiopiaEuro areaEurope & Central AsiaEurope & Central Asia (excluding high income)Europe & Central Asia (IDA & IBRD countries)European UnionFijiFinlandFragile and conflict affected situationsFranceGabonGambia, TheGeorgiaGermanyGhanaGreeceGreenlandGrenadaGuatemalaGuineaGuinea-BissauGuyanaHaitiHeavily indebted poor countries (HIPC)High incomeHondurasHong Kong SAR, ChinaHungaryIBRD onlyIcelandIDA & IBRD totalIDA blendIDA onlyIDA totalIndiaIndonesiaIran, Islamic Rep.IraqIrelandIsraelItalyJamaicaJapanJordanKazakhstanKenyaKorea, Dem. People’s Rep.Korea, Rep.KosovoKuwaitKyrgyz RepublicLao PDRLate-demographic dividendLatin America & Caribbean Latin America & Caribbean (excluding high income)Latin America & the Caribbean (IDA & IBRD countries)LatviaLeast developed countries: UN classificationLebanonLiberiaLibyaLithuaniaLow & middle incomeLow incomeLower middle incomeLuxembourgMacao SAR, ChinaMacedonia, FYRMadagascarMalawiMalaysiaMaliMaltaMauritaniaMauritiusMexicoMiddle East & North AfricaMiddle East & North Africa (excluding high income)Middle East & North Africa (IDA & IBRD countries)Middle incomeMoldovaMongoliaMontenegroMoroccoMozambiqueMyanmarNepalNetherlandsNew CaledoniaNew ZealandNicaraguaNigerNigeriaNorth AmericaNorwayOECD membersOmanOther small statesPacific island small statesPakistanPanamaPapua New GuineaParaguayPeruPhilippinesPolandPortugalPost-demographic dividendPre-demographic dividendQatarRomaniaRussian FederationRwandaSamoaSaudi ArabiaSenegalSerbiaSeychellesSierra LeoneSingaporeSlovak RepublicSloveniaSmall statesSomaliaSouth AfricaSouth AsiaSouth Asia (IDA & IBRD)SpainSri LankaSt. LuciaSub-Saharan Africa Sub-Saharan Africa (excluding high income)Sub-Saharan Africa (IDA & IBRD countries)SudanSurinameSwedenSwitzerlandSyrian Arab RepublicTajikistanTanzaniaThailandTogoTrinidad and TobagoTunisiaTurkeyTurkmenistanUgandaUkraineUnited Arab EmiratesUnited KingdomUnited StatesUpper middle incomeUruguayUzbekistanVenezuela, RBVietnamWorldYemen, Rep.ZambiaZimbabwe Timeline:
This timeline shows a graph from 1961 to 2015 of Spain. No data until 1960. Number of actual observations by date: 55.
Source name:
World Development Indicators
Source organization:
World Bank staff estimates based data from International Monetary Fund's Direction of Trade database.
Categories, topics:
Private Sector, Trade
Last updated:
apr 23, 2017
Indicators value changes by year
Maximum:
13.405
jan 1, 1983
At the date of observation
Value
Absolute change
Change from previous value
jan 1, 1961
2.552
+2.552
0.0%
jan 1, 1962
2.785
+0.233
9.13%
jan 1, 1963
2.671
-0.115
-4.11%
jan 1, 1964
2.283
-0.388
-14.53%
jan 1, 1965
2.452
+0.169
7.42%
jan 1, 1966
3.486
+1.034
42.18%
jan 1, 1967
4.192
+0.706
20.24%
jan 1, 1968
5.205
+1.013
24.16%
jan 1, 1969
4.507
-0.698
-13.4%
jan 1, 1970
5.627
+1.12
24.86%
jan 1, 1971
4.591
-1.037
-18.42%
jan 1, 1972
4.932
+0.341
7.43%
jan 1, 1973
5.977
+1.046
21.21%
jan 1, 1974
6.975
+0.998
16.69%
jan 1, 1975
8.043
+1.068
15.31%
jan 1, 1976
9.553
+1.51
18.77%
jan 1, 1977
9.087
-0.466
-4.87%
jan 1, 1978
10.91
+1.823
20.06%
jan 1, 1979
10.649
-0.261
-2.4%
jan 1, 1980
9.557
-1.092
-10.25%
jan 1, 1981
11.251
+1.693
17.72%
jan 1, 1982
12.972
+1.721
15.3%
jan 1, 1983
13.405
+0.433
3.34%
jan 1, 1984
12.433
-0.972
-7.25%
jan 1, 1985
10.307
-2.126
-17.1%
jan 1, 1986
7.659
-2.648
-25.69%
jan 1, 1987
5.177
-2.483
-32.41%
jan 1, 1988
4.467
-0.71
-13.71%
jan 1, 1989
4.303
-0.164
-3.66%
jan 1, 1990
3.605
-0.698
-16.23%
jan 1, 1991
3.725
+0.121
3.34%
jan 1, 1992
3.659
-0.066
-1.78%
jan 1, 1993
3.54
-0.119
-3.25%
jan 1, 1994
3.667
+0.127
3.6%
jan 1, 1995
3.19
-0.477
-13.02%
jan 1, 1996
3.355
+0.165
5.18%
jan 1, 1997
2.832
-0.523
-15.59%
jan 1, 1998
2.874
+0.042
1.5%
jan 1, 1999
3.006
+0.131
4.56%
jan 1, 2000
3.009
+0.004
0.12%
jan 1, 2001
3.012
+0.002
0.07%
jan 1, 2002
3.17
+0.159
5.27%
jan 1, 2003
3.303
+0.133
4.19%
jan 1, 2004
3.25
-0.053
-1.59%
jan 1, 2005
3.524
+0.273
8.41%
jan 1, 2006
3.438
-0.086
-2.43%
jan 1, 2007
3.199
-0.24
-6.97%
jan 1, 2008
3.536
+0.338
10.55%
jan 1, 2009
4.369
+0.833
23.56%
jan 1, 2010
4.842
+0.473
10.83%
jan 1, 2011
4.48
-0.362
-7.49%
jan 1, 2012
4.478
-0.002
-0.04%
jan 1, 2013
5.479
+1.001
22.36%
jan 1, 2014
5.528
+0.049
0.9%
jan 1, 2015
5.547
+0.019
0.34%
Ranking of countries by current statistics by years


Comments: