29
/
en
AIzaSyAYiBZKx7MnpbEhh9jyipgxe19OcubqV5w
April 1, 2024
101335
Canada
CAN
true
2
1
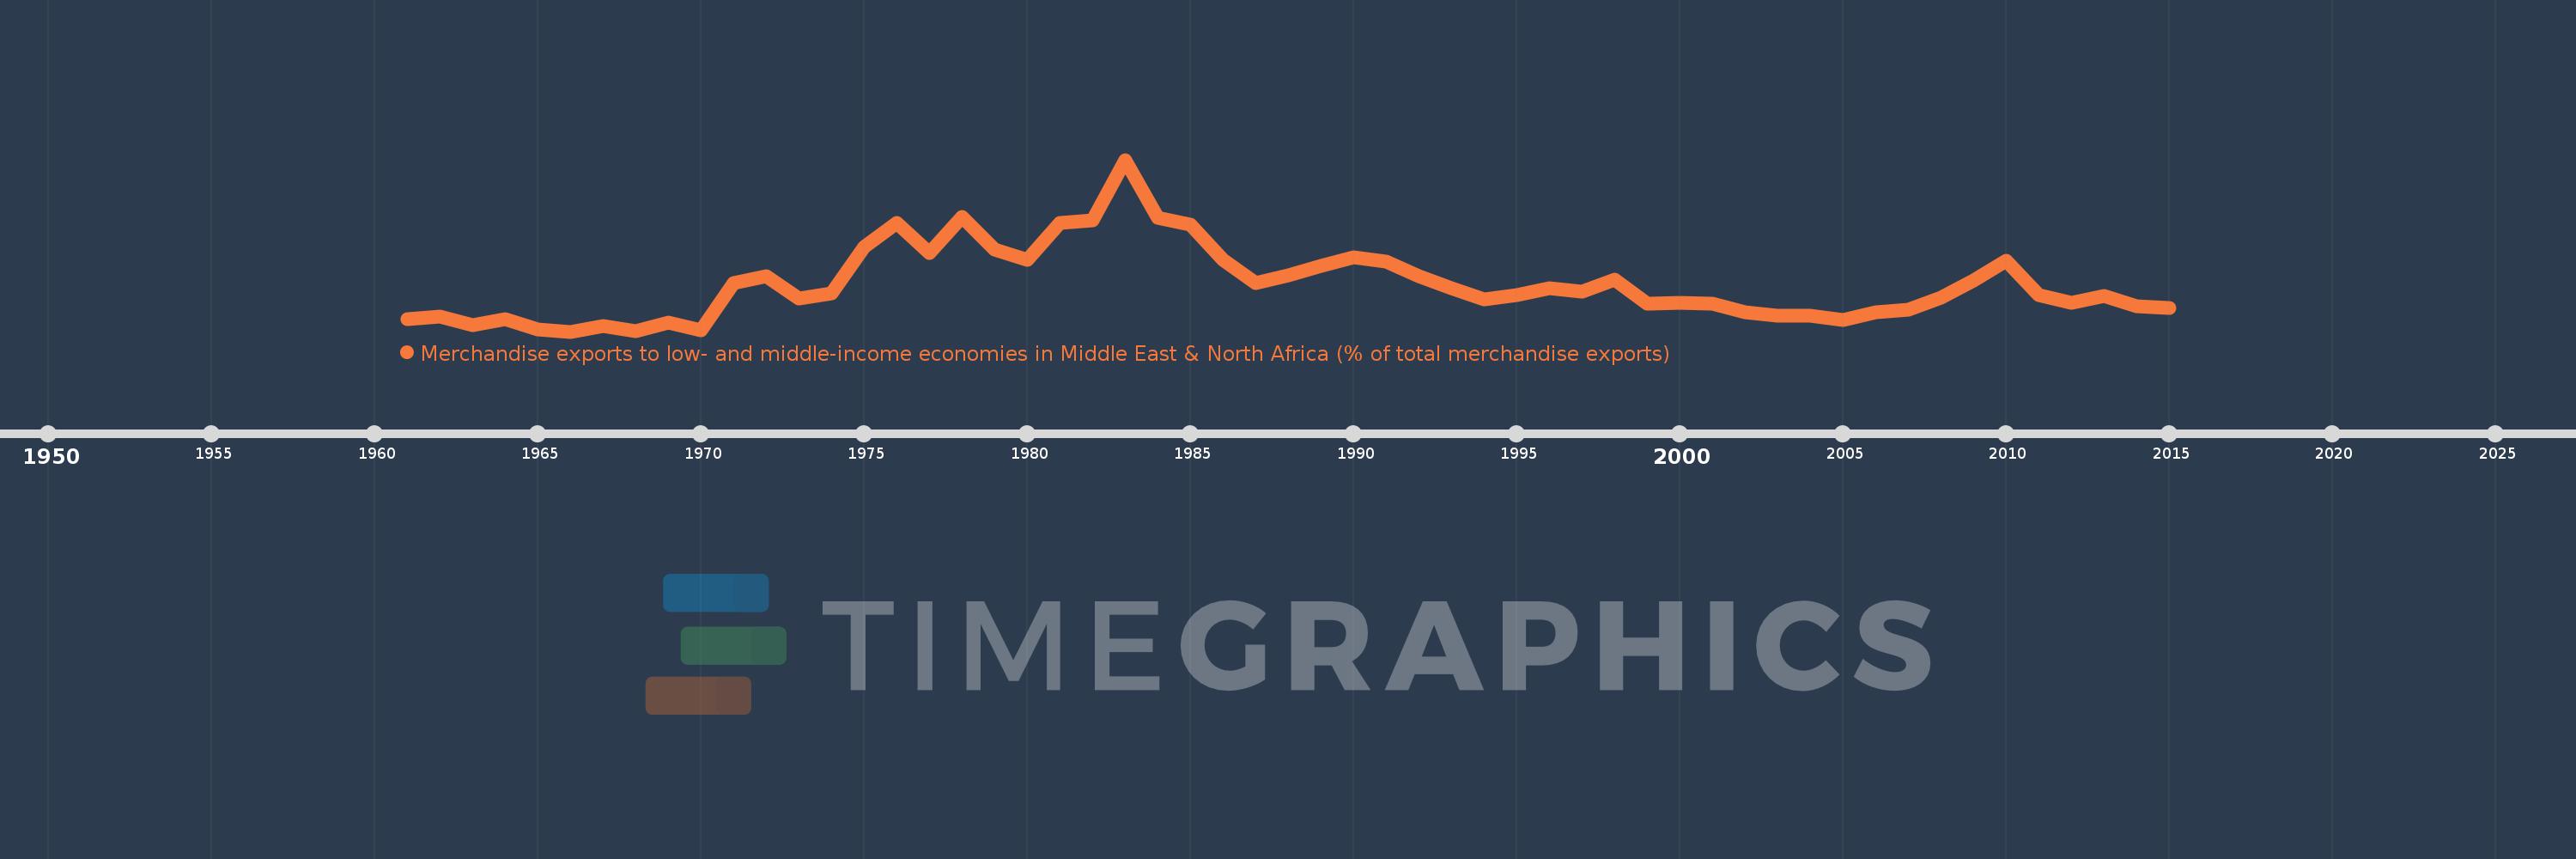
Merchandise exports to low- and middle-income economies in Middle East & North Africa (% of total merchandise exports)
2015,2014,2013,2012,2011,2010,2009,2008,2007,2006,2005,2004,2003,2002,2001,2000,1999,1998,1997,1996,1995,1994,1993,1992,1991,1990,1989,1988,1987,1986,1985,1984,1983,1982,1981,1980,1979,1978,1977,1976,1975,1974,1973,1972,1971,1970,1969,1968,1967,1966,1965,1964,1963,1962,1961
This statistics in other country:
AfghanistanAlbaniaAlgeriaAngolaArab WorldArgentinaArmeniaArubaAustraliaAustriaAzerbaijanBahamas, TheBahrainBangladeshBarbadosBelarusBelgiumBelizeBeninBermudaBoliviaBosnia and HerzegovinaBrazilBrunei DarussalamBulgariaBurkina FasoBurundiCabo VerdeCambodiaCameroonCanadaCaribbean small statesCentral African RepublicCentral Europe and the BalticsChadChileChinaColombiaComorosCongo, Dem. Rep.Congo, Rep.Costa RicaCote d'IvoireCroatiaCubaCyprusCzech RepublicDenmarkDjiboutiDominicaDominican RepublicEarly-demographic dividendEast Asia & PacificEast Asia & Pacific (excluding high income)East Asia & Pacific (IDA & IBRD countries)EcuadorEgypt, Arab Rep.El SalvadorEquatorial GuineaEstoniaEthiopiaEuro areaEurope & Central AsiaEurope & Central Asia (excluding high income)Europe & Central Asia (IDA & IBRD countries)European UnionFijiFinlandFragile and conflict affected situationsFranceGabonGambia, TheGeorgiaGermanyGhanaGreeceGreenlandGrenadaGuatemalaGuineaGuinea-BissauGuyanaHaitiHeavily indebted poor countries (HIPC)High incomeHondurasHong Kong SAR, ChinaHungaryIBRD onlyIcelandIDA & IBRD totalIDA blendIDA onlyIDA totalIndiaIndonesiaIran, Islamic Rep.IraqIrelandIsraelItalyJamaicaJapanJordanKazakhstanKenyaKorea, Dem. People’s Rep.Korea, Rep.KosovoKuwaitKyrgyz RepublicLao PDRLate-demographic dividendLatin America & Caribbean Latin America & Caribbean (excluding high income)Latin America & the Caribbean (IDA & IBRD countries)LatviaLeast developed countries: UN classificationLebanonLiberiaLibyaLithuaniaLow & middle incomeLow incomeLower middle incomeLuxembourgMacao SAR, ChinaMacedonia, FYRMadagascarMalawiMalaysiaMaliMaltaMauritaniaMauritiusMexicoMiddle East & North AfricaMiddle East & North Africa (excluding high income)Middle East & North Africa (IDA & IBRD countries)Middle incomeMoldovaMongoliaMontenegroMoroccoMozambiqueMyanmarNepalNetherlandsNew CaledoniaNew ZealandNicaraguaNigerNigeriaNorth AmericaNorwayOECD membersOmanOther small statesPacific island small statesPakistanPanamaPapua New GuineaParaguayPeruPhilippinesPolandPortugalPost-demographic dividendPre-demographic dividendQatarRomaniaRussian FederationRwandaSamoaSaudi ArabiaSenegalSerbiaSeychellesSierra LeoneSingaporeSlovak RepublicSloveniaSmall statesSomaliaSouth AfricaSouth AsiaSouth Asia (IDA & IBRD)SpainSri LankaSt. LuciaSub-Saharan Africa Sub-Saharan Africa (excluding high income)Sub-Saharan Africa (IDA & IBRD countries)SudanSurinameSwedenSwitzerlandSyrian Arab RepublicTajikistanTanzaniaThailandTogoTrinidad and TobagoTunisiaTurkeyTurkmenistanUgandaUkraineUnited Arab EmiratesUnited KingdomUnited StatesUpper middle incomeUruguayUzbekistanVenezuela, RBVietnamWorldYemen, Rep.ZambiaZimbabwe Timeline:
This timeline shows a graph from 1961 to 2015 of Canada. No data until 1960. Number of actual observations by date: 55.
Source name:
World Development Indicators
Source organization:
World Bank staff estimates based data from International Monetary Fund's Direction of Trade database.
Categories, topics:
Private Sector, Trade
Last updated:
apr 23, 2017
Indicators value changes by year
At the date of observation
Value
Absolute change
Change from previous value
jan 1, 1961
0.285
+0.285
0.0%
jan 1, 1962
0.308
+0.023
8.13%
jan 1, 1963
0.221
-0.087
-28.27%
jan 1, 1964
0.281
+0.06
27.25%
jan 1, 1965
0.18
-0.101
-35.88%
jan 1, 1966
0.161
-0.02
-10.88%
jan 1, 1967
0.213
+0.052
32.54%
jan 1, 1968
0.168
-0.045
-21.29%
jan 1, 1969
0.249
+0.081
48.32%
jan 1, 1970
0.176
-0.073
-29.38%
jan 1, 1971
0.632
+0.456
259.68%
jan 1, 1972
0.692
+0.061
9.61%
jan 1, 1973
0.479
-0.214
-30.87%
jan 1, 1974
0.529
+0.051
10.57%
jan 1, 1975
0.973
+0.444
83.85%
jan 1, 1976
1.213
+0.24
24.63%
jan 1, 1977
0.921
-0.292
-24.05%
jan 1, 1978
1.269
+0.348
37.76%
jan 1, 1979
0.949
-0.32
-25.22%
jan 1, 1980
0.855
-0.094
-9.86%
jan 1, 1981
1.208
+0.353
41.24%
jan 1, 1982
1.238
+0.03
2.51%
jan 1, 1983
1.818
+0.579
46.79%
jan 1, 1984
1.259
-0.559
-30.76%
jan 1, 1985
1.192
-0.067
-5.33%
jan 1, 1986
0.853
-0.339
-28.45%
jan 1, 1987
0.632
-0.22
-25.82%
jan 1, 1988
0.704
+0.071
11.26%
jan 1, 1989
0.795
+0.091
12.96%
jan 1, 1990
0.876
+0.081
10.23%
jan 1, 1991
0.837
-0.039
-4.44%
jan 1, 1992
0.697
-0.14
-16.7%
jan 1, 1993
0.577
-0.12
-17.27%
jan 1, 1994
0.473
-0.104
-18.03%
jan 1, 1995
0.509
+0.036
7.58%
jan 1, 1996
0.576
+0.068
13.29%
jan 1, 1997
0.548
-0.028
-4.88%
jan 1, 1998
0.659
+0.111
20.22%
jan 1, 1999
0.432
-0.227
-34.43%
jan 1, 2000
0.441
+0.008
1.94%
jan 1, 2001
0.427
-0.014
-3.21%
jan 1, 2002
0.351
-0.076
-17.74%
jan 1, 2003
0.314
-0.037
-10.53%
jan 1, 2004
0.314
0.0
-0.09%
jan 1, 2005
0.276
-0.037
-11.9%
jan 1, 2006
0.348
+0.072
25.94%
jan 1, 2007
0.37
+0.022
6.2%
jan 1, 2008
0.487
+0.118
31.88%
jan 1, 2009
0.656
+0.168
34.53%
jan 1, 2010
0.842
+0.187
28.49%
jan 1, 2011
0.513
-0.329
-39.12%
jan 1, 2012
0.437
-0.076
-14.87%
jan 1, 2013
0.501
+0.065
14.82%
jan 1, 2014
0.404
-0.098
-19.49%
jan 1, 2015
0.385
-0.018
-4.54%
Ranking of countries by current statistics by years


Comments: