29
/
en
AIzaSyAYiBZKx7MnpbEhh9jyipgxe19OcubqV5w
April 1, 2024
275935
United Kingdom
GBR
true
2
1
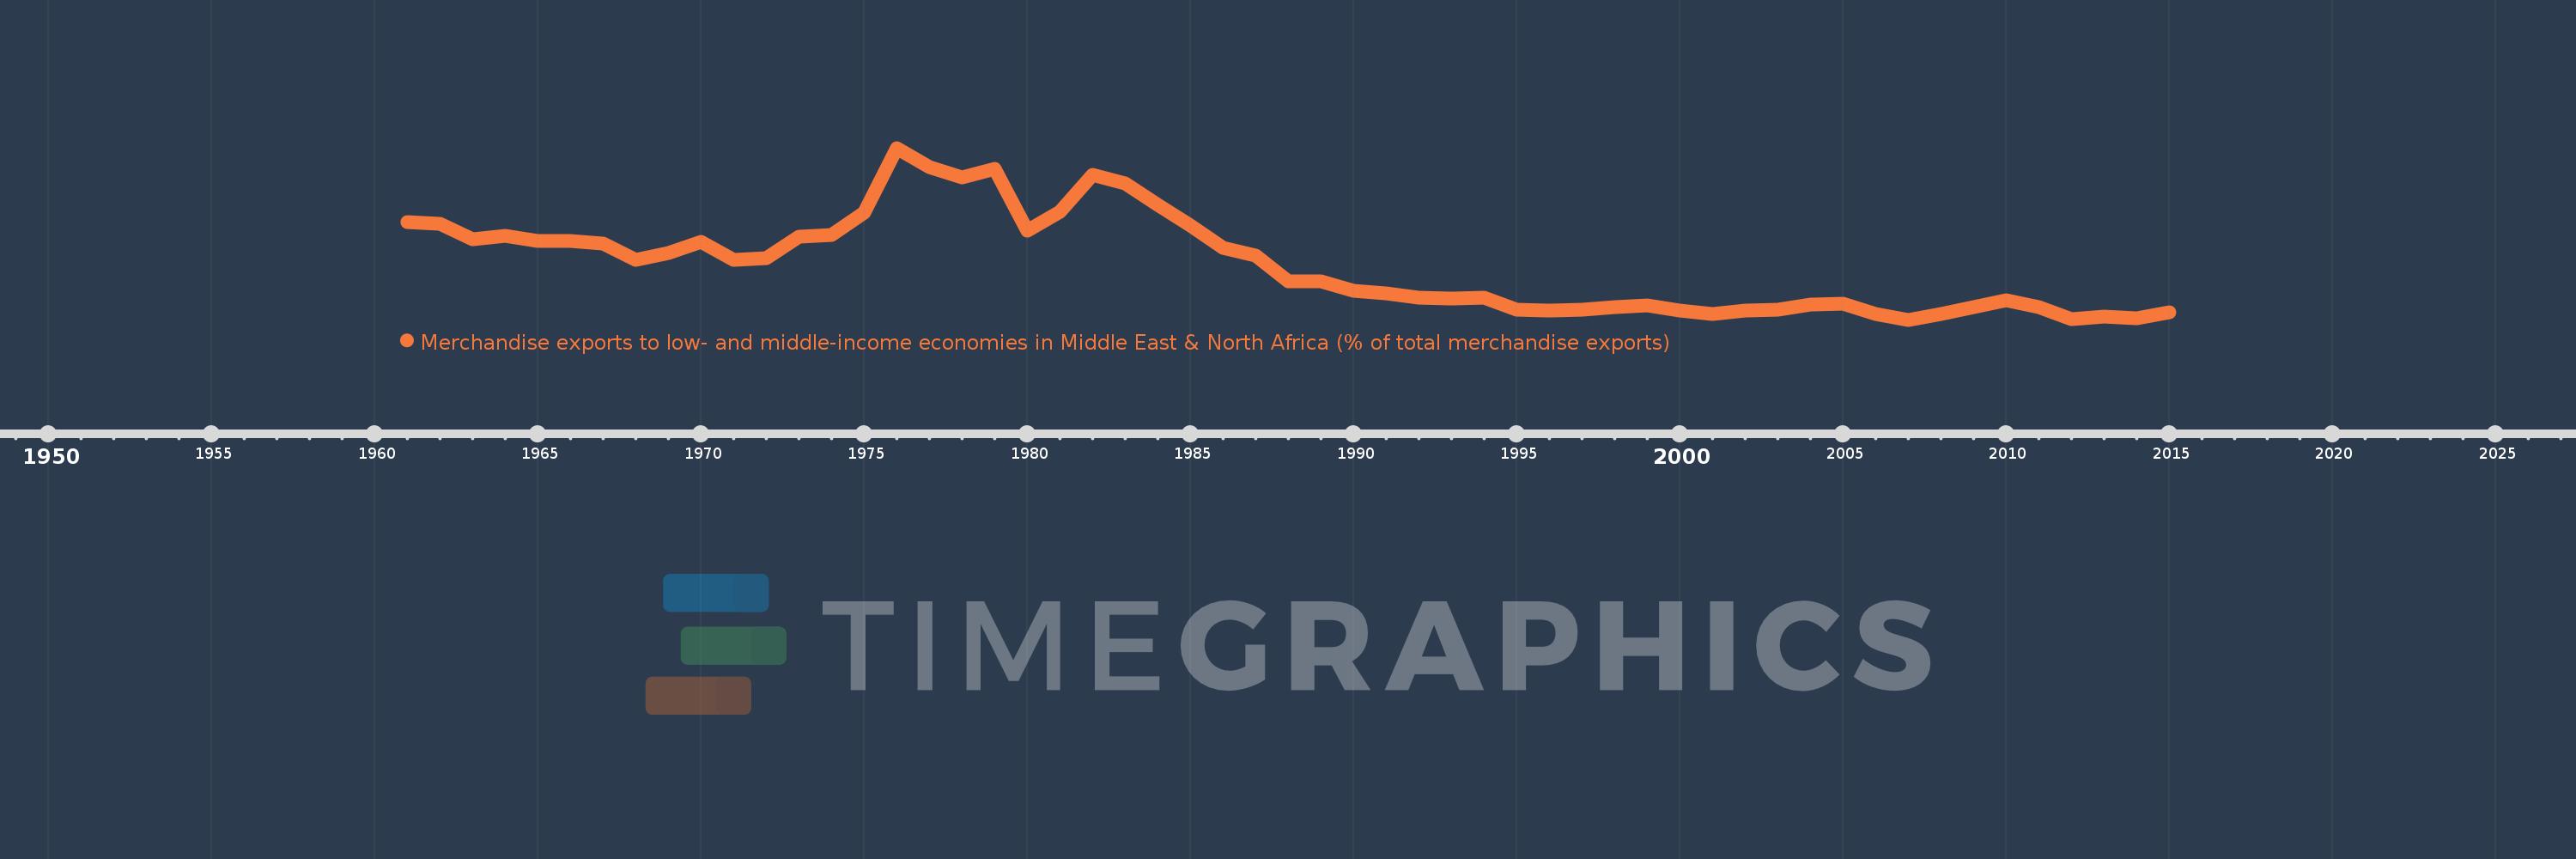
Merchandise exports to low- and middle-income economies in Middle East & North Africa (% of total merchandise exports)
2015,2014,2013,2012,2011,2010,2009,2008,2007,2006,2005,2004,2003,2002,2001,2000,1999,1998,1997,1996,1995,1994,1993,1992,1991,1990,1989,1988,1987,1986,1985,1984,1983,1982,1981,1980,1979,1978,1977,1976,1975,1974,1973,1972,1971,1970,1969,1968,1967,1966,1965,1964,1963,1962,1961
This statistics in other country:
AfghanistanAlbaniaAlgeriaAngolaArab WorldArgentinaArmeniaArubaAustraliaAustriaAzerbaijanBahamas, TheBahrainBangladeshBarbadosBelarusBelgiumBelizeBeninBermudaBoliviaBosnia and HerzegovinaBrazilBrunei DarussalamBulgariaBurkina FasoBurundiCabo VerdeCambodiaCameroonCanadaCaribbean small statesCentral African RepublicCentral Europe and the BalticsChadChileChinaColombiaComorosCongo, Dem. Rep.Congo, Rep.Costa RicaCote d'IvoireCroatiaCubaCyprusCzech RepublicDenmarkDjiboutiDominicaDominican RepublicEarly-demographic dividendEast Asia & PacificEast Asia & Pacific (excluding high income)East Asia & Pacific (IDA & IBRD countries)EcuadorEgypt, Arab Rep.El SalvadorEquatorial GuineaEstoniaEthiopiaEuro areaEurope & Central AsiaEurope & Central Asia (excluding high income)Europe & Central Asia (IDA & IBRD countries)European UnionFijiFinlandFragile and conflict affected situationsFranceGabonGambia, TheGeorgiaGermanyGhanaGreeceGreenlandGrenadaGuatemalaGuineaGuinea-BissauGuyanaHaitiHeavily indebted poor countries (HIPC)High incomeHondurasHong Kong SAR, ChinaHungaryIBRD onlyIcelandIDA & IBRD totalIDA blendIDA onlyIDA totalIndiaIndonesiaIran, Islamic Rep.IraqIrelandIsraelItalyJamaicaJapanJordanKazakhstanKenyaKorea, Dem. People’s Rep.Korea, Rep.KosovoKuwaitKyrgyz RepublicLao PDRLate-demographic dividendLatin America & Caribbean Latin America & Caribbean (excluding high income)Latin America & the Caribbean (IDA & IBRD countries)LatviaLeast developed countries: UN classificationLebanonLiberiaLibyaLithuaniaLow & middle incomeLow incomeLower middle incomeLuxembourgMacao SAR, ChinaMacedonia, FYRMadagascarMalawiMalaysiaMaliMaltaMauritaniaMauritiusMexicoMiddle East & North AfricaMiddle East & North Africa (excluding high income)Middle East & North Africa (IDA & IBRD countries)Middle incomeMoldovaMongoliaMontenegroMoroccoMozambiqueMyanmarNepalNetherlandsNew CaledoniaNew ZealandNicaraguaNigerNigeriaNorth AmericaNorwayOECD membersOmanOther small statesPacific island small statesPakistanPanamaPapua New GuineaParaguayPeruPhilippinesPolandPortugalPost-demographic dividendPre-demographic dividendQatarRomaniaRussian FederationRwandaSamoaSaudi ArabiaSenegalSerbiaSeychellesSierra LeoneSingaporeSlovak RepublicSloveniaSmall statesSomaliaSouth AfricaSouth AsiaSouth Asia (IDA & IBRD)SpainSri LankaSt. LuciaSub-Saharan Africa Sub-Saharan Africa (excluding high income)Sub-Saharan Africa (IDA & IBRD countries)SudanSurinameSwedenSwitzerlandSyrian Arab RepublicTajikistanTanzaniaThailandTogoTrinidad and TobagoTunisiaTurkeyTurkmenistanUgandaUkraineUnited Arab EmiratesUnited KingdomUnited StatesUpper middle incomeUruguayUzbekistanVenezuela, RBVietnamWorldYemen, Rep.ZambiaZimbabwe Timeline:
This timeline shows a graph from 1961 to 2015 of United Kingdom. No data until 1960. Number of actual observations by date: 55.
Source name:
World Development Indicators
Source organization:
World Bank staff estimates based data from International Monetary Fund's Direction of Trade database.
Categories, topics:
Private Sector, Trade
Last updated:
apr 23, 2017
Indicators value changes by year
At the date of observation
Value
Absolute change
Change from previous value
jan 1, 1961
3.622
+3.622
0.0%
jan 1, 1962
3.583
-0.038
-1.05%
jan 1, 1963
3.162
-0.422
-11.77%
jan 1, 1964
3.258
+0.097
3.06%
jan 1, 1965
3.113
-0.145
-4.46%
jan 1, 1966
3.105
-0.008
-0.24%
jan 1, 1967
3.045
-0.061
-1.95%
jan 1, 1968
2.591
-0.454
-14.9%
jan 1, 1969
2.779
+0.188
7.24%
jan 1, 1970
3.086
+0.307
11.05%
jan 1, 1971
2.598
-0.488
-15.81%
jan 1, 1972
2.644
+0.046
1.77%
jan 1, 1973
3.221
+0.577
21.84%
jan 1, 1974
3.284
+0.063
1.95%
jan 1, 1975
3.878
+0.593
18.07%
jan 1, 1976
5.651
+1.774
45.74%
jan 1, 1977
5.12
-0.532
-9.41%
jan 1, 1978
4.835
-0.285
-5.56%
jan 1, 1979
5.082
+0.246
5.1%
jan 1, 1980
3.379
-1.702
-33.5%
jan 1, 1981
3.908
+0.529
15.67%
jan 1, 1982
4.921
+1.013
25.91%
jan 1, 1983
4.676
-0.245
-4.99%
jan 1, 1984
4.096
-0.58
-12.4%
jan 1, 1985
3.538
-0.558
-13.63%
jan 1, 1986
2.928
-0.61
-17.24%
jan 1, 1987
2.719
-0.209
-7.13%
jan 1, 1988
2.015
-0.704
-25.91%
jan 1, 1989
2.012
-0.002
-0.11%
jan 1, 1990
1.739
-0.273
-13.57%
jan 1, 1991
1.675
-0.064
-3.7%
jan 1, 1992
1.55
-0.125
-7.45%
jan 1, 1993
1.54
-0.01
-0.68%
jan 1, 1994
1.553
+0.013
0.87%
jan 1, 1995
1.224
-0.33
-21.22%
jan 1, 1996
1.206
-0.017
-1.4%
jan 1, 1997
1.228
+0.021
1.77%
jan 1, 1998
1.311
+0.083
6.75%
jan 1, 1999
1.337
+0.027
2.04%
jan 1, 2000
1.213
-0.125
-9.32%
jan 1, 2001
1.119
-0.094
-7.71%
jan 1, 2002
1.213
+0.094
8.39%
jan 1, 2003
1.219
+0.006
0.47%
jan 1, 2004
1.375
+0.156
12.81%
jan 1, 2005
1.39
+0.015
1.06%
jan 1, 2006
1.106
-0.284
-20.42%
jan 1, 2007
0.956
-0.15
-13.57%
jan 1, 2008
1.115
+0.159
16.65%
jan 1, 2009
1.303
+0.189
16.91%
jan 1, 2010
1.49
+0.186
14.3%
jan 1, 2011
1.311
-0.178
-11.97%
jan 1, 2012
0.973
-0.339
-25.82%
jan 1, 2013
1.037
+0.065
6.63%
jan 1, 2014
0.986
-0.052
-4.98%
jan 1, 2015
1.165
+0.18
18.21%
Ranking of countries by current statistics by years


Comments: