29
/
en
AIzaSyAYiBZKx7MnpbEhh9jyipgxe19OcubqV5w
April 1, 2024
24287
Arab World
ARB
false
2
1
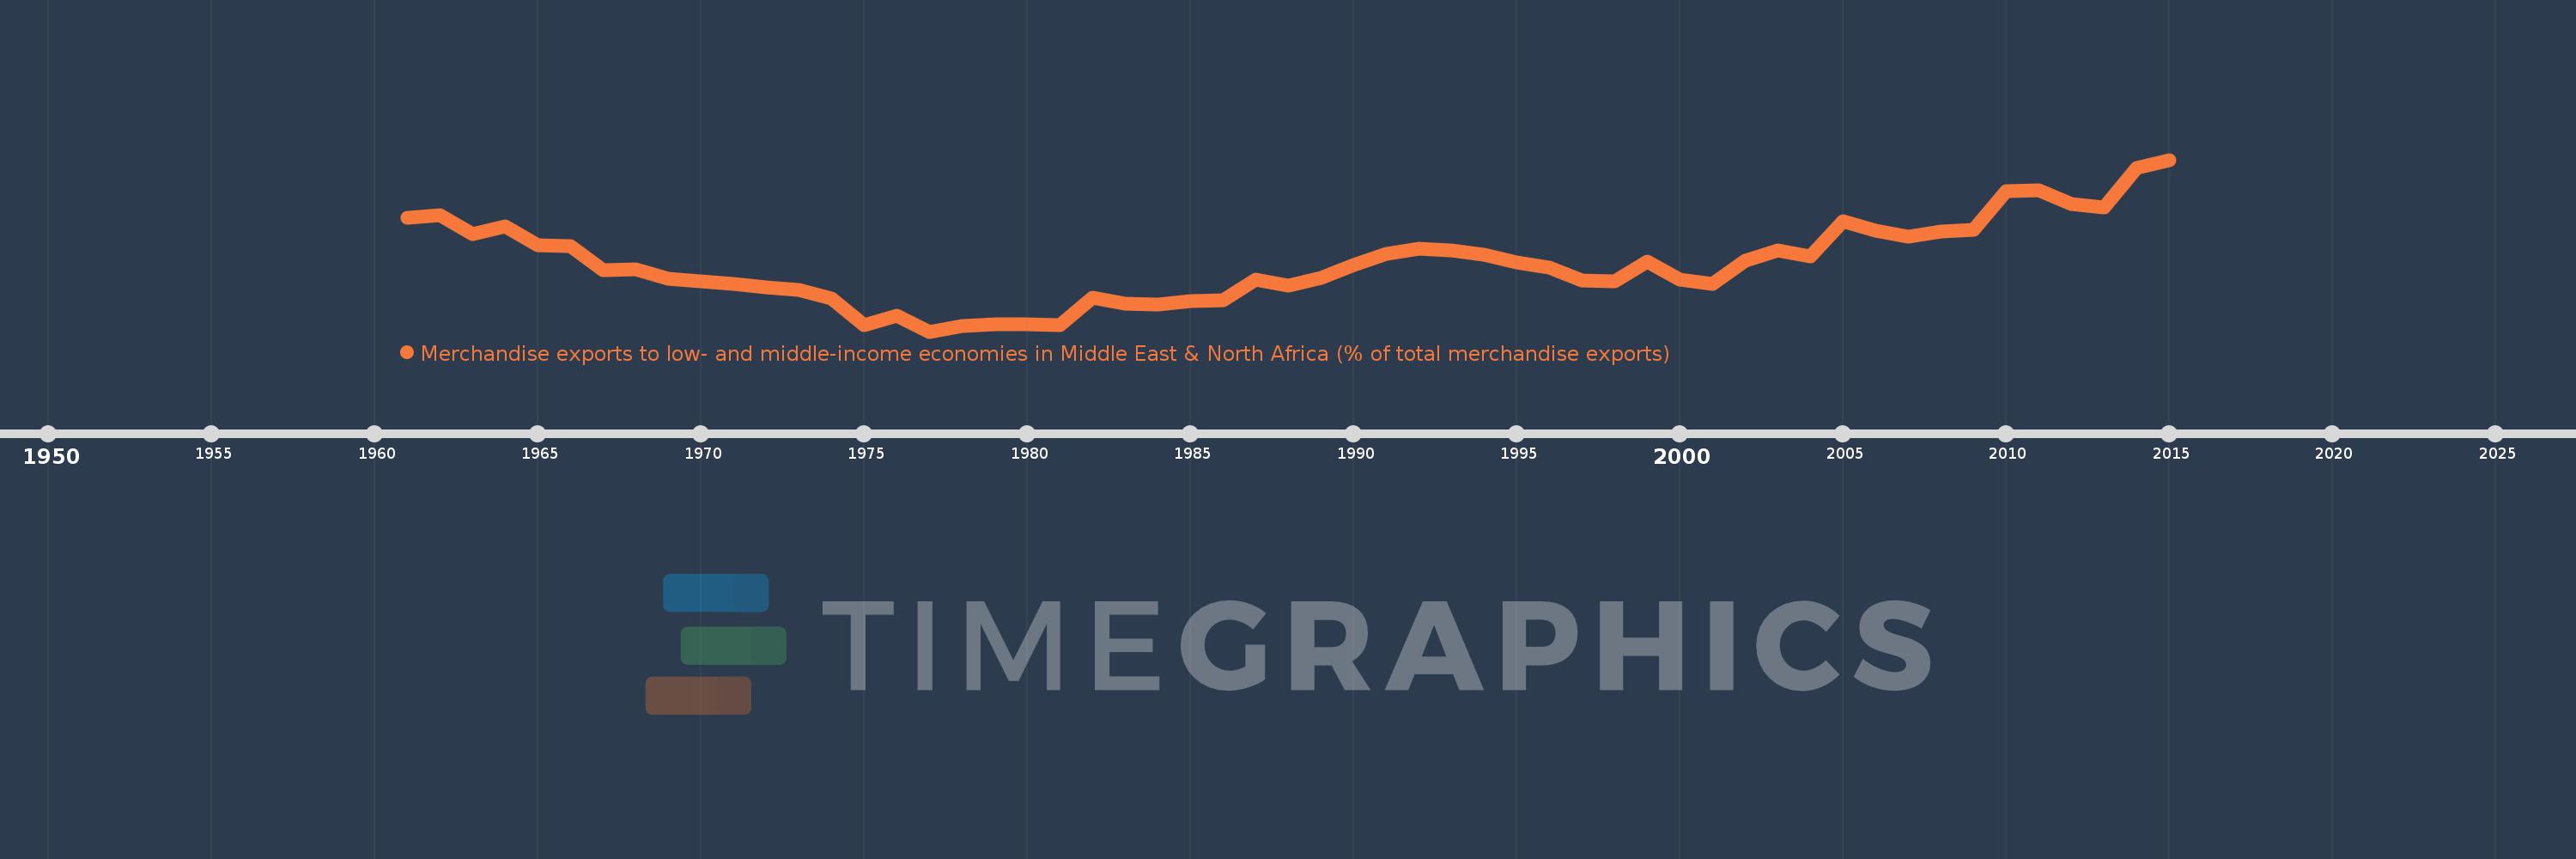
Merchandise exports to low- and middle-income economies in Middle East & North Africa (% of total merchandise exports)
2015,2014,2013,2012,2011,2010,2009,2008,2007,2006,2005,2004,2003,2002,2001,2000,1999,1998,1997,1996,1995,1994,1993,1992,1991,1990,1989,1988,1987,1986,1985,1984,1983,1982,1981,1980,1979,1978,1977,1976,1975,1974,1973,1972,1971,1970,1969,1968,1967,1966,1965,1964,1963,1962,1961
This statistics in other country:
AfghanistanAlbaniaAlgeriaAngolaArab WorldArgentinaArmeniaArubaAustraliaAustriaAzerbaijanBahamas, TheBahrainBangladeshBarbadosBelarusBelgiumBelizeBeninBermudaBoliviaBosnia and HerzegovinaBrazilBrunei DarussalamBulgariaBurkina FasoBurundiCabo VerdeCambodiaCameroonCanadaCaribbean small statesCentral African RepublicCentral Europe and the BalticsChadChileChinaColombiaComorosCongo, Dem. Rep.Congo, Rep.Costa RicaCote d'IvoireCroatiaCubaCyprusCzech RepublicDenmarkDjiboutiDominicaDominican RepublicEarly-demographic dividendEast Asia & PacificEast Asia & Pacific (excluding high income)East Asia & Pacific (IDA & IBRD countries)EcuadorEgypt, Arab Rep.El SalvadorEquatorial GuineaEstoniaEthiopiaEuro areaEurope & Central AsiaEurope & Central Asia (excluding high income)Europe & Central Asia (IDA & IBRD countries)European UnionFijiFinlandFragile and conflict affected situationsFranceGabonGambia, TheGeorgiaGermanyGhanaGreeceGreenlandGrenadaGuatemalaGuineaGuinea-BissauGuyanaHaitiHeavily indebted poor countries (HIPC)High incomeHondurasHong Kong SAR, ChinaHungaryIBRD onlyIcelandIDA & IBRD totalIDA blendIDA onlyIDA totalIndiaIndonesiaIran, Islamic Rep.IraqIrelandIsraelItalyJamaicaJapanJordanKazakhstanKenyaKorea, Dem. People’s Rep.Korea, Rep.KosovoKuwaitKyrgyz RepublicLao PDRLate-demographic dividendLatin America & Caribbean Latin America & Caribbean (excluding high income)Latin America & the Caribbean (IDA & IBRD countries)LatviaLeast developed countries: UN classificationLebanonLiberiaLibyaLithuaniaLow & middle incomeLow incomeLower middle incomeLuxembourgMacao SAR, ChinaMacedonia, FYRMadagascarMalawiMalaysiaMaliMaltaMauritaniaMauritiusMexicoMiddle East & North AfricaMiddle East & North Africa (excluding high income)Middle East & North Africa (IDA & IBRD countries)Middle incomeMoldovaMongoliaMontenegroMoroccoMozambiqueMyanmarNepalNetherlandsNew CaledoniaNew ZealandNicaraguaNigerNigeriaNorth AmericaNorwayOECD membersOmanOther small statesPacific island small statesPakistanPanamaPapua New GuineaParaguayPeruPhilippinesPolandPortugalPost-demographic dividendPre-demographic dividendQatarRomaniaRussian FederationRwandaSamoaSaudi ArabiaSenegalSerbiaSeychellesSierra LeoneSingaporeSlovak RepublicSloveniaSmall statesSomaliaSouth AfricaSouth AsiaSouth Asia (IDA & IBRD)SpainSri LankaSt. LuciaSub-Saharan Africa Sub-Saharan Africa (excluding high income)Sub-Saharan Africa (IDA & IBRD countries)SudanSurinameSwedenSwitzerlandSyrian Arab RepublicTajikistanTanzaniaThailandTogoTrinidad and TobagoTunisiaTurkeyTurkmenistanUgandaUkraineUnited Arab EmiratesUnited KingdomUnited StatesUpper middle incomeUruguayUzbekistanVenezuela, RBVietnamWorldYemen, Rep.ZambiaZimbabwe Timeline:
This timeline shows a graph from 1961 to 2015 of Arab World. No data until 1960. Number of actual observations by date: 55.
Source name:
World Development Indicators
Source organization:
World Bank staff estimates based data from International Monetary Fund's Direction of Trade database.
Categories, topics:
Private Sector, Trade
Last updated:
apr 23, 2017
Indicators value changes by year
At the date of observation
Value
Absolute change
Change from previous value
jan 1, 1961
6.38
+6.38
0.0%
jan 1, 1962
6.491
+0.112
1.75%
jan 1, 1963
5.641
-0.85
-13.1%
jan 1, 1964
5.99
+0.348
6.18%
jan 1, 1965
5.152
-0.838
-13.99%
jan 1, 1966
5.106
-0.046
-0.89%
jan 1, 1967
4.053
-1.053
-20.62%
jan 1, 1968
4.078
+0.025
0.61%
jan 1, 1969
3.652
-0.426
-10.43%
jan 1, 1970
3.549
-0.103
-2.82%
jan 1, 1971
3.445
-0.105
-2.95%
jan 1, 1972
3.293
-0.152
-4.4%
jan 1, 1973
3.15
-0.143
-4.35%
jan 1, 1974
2.786
-0.364
-11.56%
jan 1, 1975
1.593
-1.193
-42.81%
jan 1, 1976
2.035
+0.442
27.74%
jan 1, 1977
1.311
-0.724
-35.58%
jan 1, 1978
1.541
+0.23
17.52%
jan 1, 1979
1.633
+0.092
5.98%
jan 1, 1980
1.65
+0.018
1.08%
jan 1, 1981
1.586
-0.065
-3.91%
jan 1, 1982
2.802
+1.216
76.71%
jan 1, 1983
2.543
-0.26
-9.26%
jan 1, 1984
2.524
-0.019
-0.75%
jan 1, 1985
2.652
+0.128
5.09%
jan 1, 1986
2.712
+0.059
2.24%
jan 1, 1987
3.628
+0.916
33.78%
jan 1, 1988
3.355
-0.272
-7.5%
jan 1, 1989
3.685
+0.33
9.83%
jan 1, 1990
4.283
+0.597
16.21%
jan 1, 1991
4.761
+0.478
11.16%
jan 1, 1992
4.98
+0.219
4.61%
jan 1, 1993
4.903
-0.077
-1.54%
jan 1, 1994
4.72
-0.184
-3.75%
jan 1, 1995
4.375
-0.345
-7.31%
jan 1, 1996
4.16
-0.215
-4.91%
jan 1, 1997
3.588
-0.571
-13.74%
jan 1, 1998
3.531
-0.057
-1.58%
jan 1, 1999
4.407
+0.875
24.79%
jan 1, 2000
3.609
-0.798
-18.11%
jan 1, 2001
3.442
-0.167
-4.62%
jan 1, 2002
4.445
+1.003
29.14%
jan 1, 2003
4.912
+0.467
10.51%
jan 1, 2004
4.669
-0.244
-4.96%
jan 1, 2005
6.216
+1.548
33.15%
jan 1, 2006
5.811
-0.405
-6.52%
jan 1, 2007
5.547
-0.264
-4.54%
jan 1, 2008
5.754
+0.207
3.74%
jan 1, 2009
5.838
+0.084
1.46%
jan 1, 2010
7.545
+1.707
29.23%
jan 1, 2011
7.572
+0.027
0.36%
jan 1, 2012
6.993
-0.579
-7.64%
jan 1, 2013
6.812
-0.182
-2.6%
jan 1, 2014
8.591
+1.779
26.12%
jan 1, 2015
8.946
+0.355
4.13%
Ranking of countries by current statistics by years


Comments: