29
/
en
AIzaSyAYiBZKx7MnpbEhh9jyipgxe19OcubqV5w
April 1, 2024
66280
Algeria
DZA
true
2
1
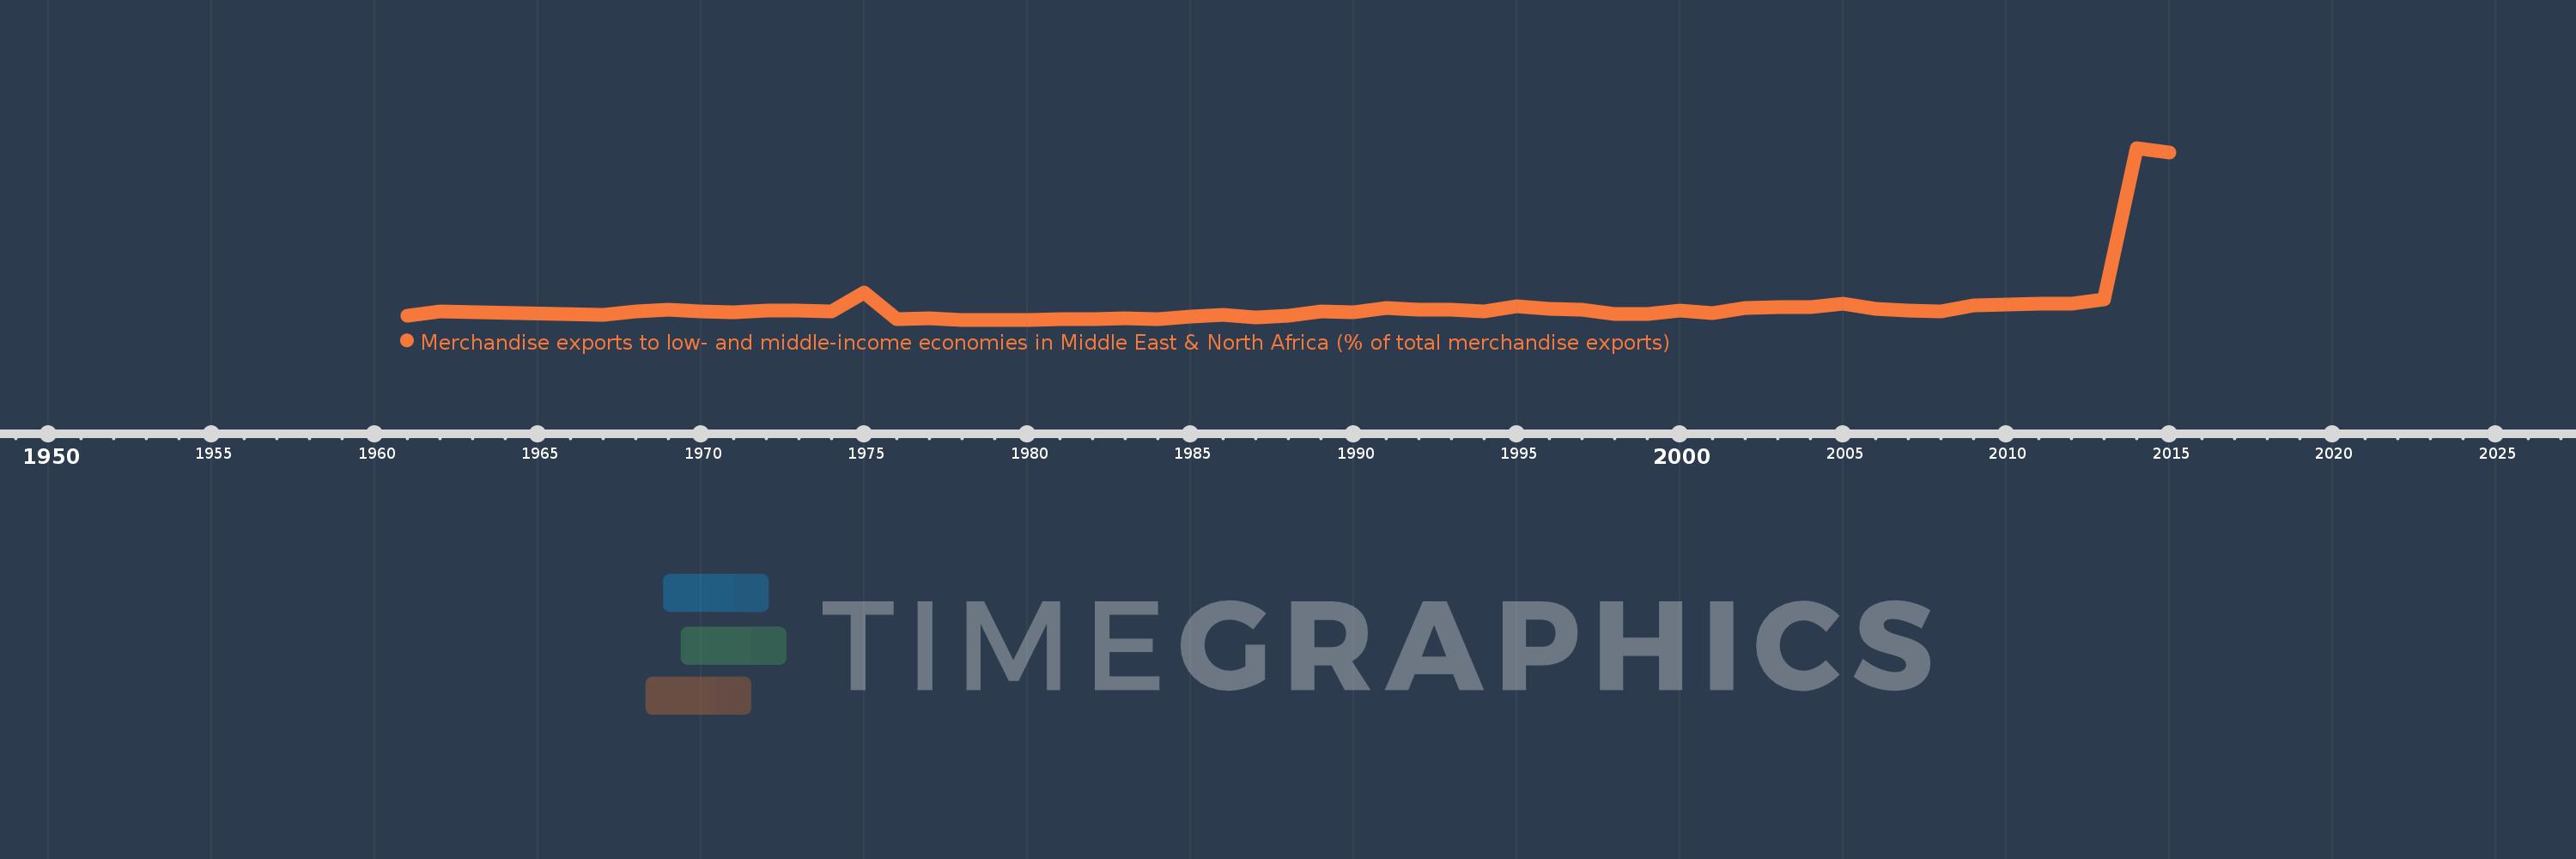
Merchandise exports to low- and middle-income economies in Middle East & North Africa (% of total merchandise exports)
2015,2014,2013,2012,2011,2010,2009,2008,2007,2006,2005,2004,2003,2002,2001,2000,1999,1998,1997,1996,1995,1994,1993,1992,1991,1990,1989,1988,1987,1986,1985,1984,1983,1982,1981,1980,1979,1978,1977,1976,1975,1974,1973,1972,1971,1970,1969,1968,1967,1962,1961
This statistics in other country:
AfghanistanAlbaniaAlgeriaAngolaArab WorldArgentinaArmeniaArubaAustraliaAustriaAzerbaijanBahamas, TheBahrainBangladeshBarbadosBelarusBelgiumBelizeBeninBermudaBoliviaBosnia and HerzegovinaBrazilBrunei DarussalamBulgariaBurkina FasoBurundiCabo VerdeCambodiaCameroonCanadaCaribbean small statesCentral African RepublicCentral Europe and the BalticsChadChileChinaColombiaComorosCongo, Dem. Rep.Congo, Rep.Costa RicaCote d'IvoireCroatiaCubaCyprusCzech RepublicDenmarkDjiboutiDominicaDominican RepublicEarly-demographic dividendEast Asia & PacificEast Asia & Pacific (excluding high income)East Asia & Pacific (IDA & IBRD countries)EcuadorEgypt, Arab Rep.El SalvadorEquatorial GuineaEstoniaEthiopiaEuro areaEurope & Central AsiaEurope & Central Asia (excluding high income)Europe & Central Asia (IDA & IBRD countries)European UnionFijiFinlandFragile and conflict affected situationsFranceGabonGambia, TheGeorgiaGermanyGhanaGreeceGreenlandGrenadaGuatemalaGuineaGuinea-BissauGuyanaHaitiHeavily indebted poor countries (HIPC)High incomeHondurasHong Kong SAR, ChinaHungaryIBRD onlyIcelandIDA & IBRD totalIDA blendIDA onlyIDA totalIndiaIndonesiaIran, Islamic Rep.IraqIrelandIsraelItalyJamaicaJapanJordanKazakhstanKenyaKorea, Dem. People’s Rep.Korea, Rep.KosovoKuwaitKyrgyz RepublicLao PDRLate-demographic dividendLatin America & Caribbean Latin America & Caribbean (excluding high income)Latin America & the Caribbean (IDA & IBRD countries)LatviaLeast developed countries: UN classificationLebanonLiberiaLibyaLithuaniaLow & middle incomeLow incomeLower middle incomeLuxembourgMacao SAR, ChinaMacedonia, FYRMadagascarMalawiMalaysiaMaliMaltaMauritaniaMauritiusMexicoMiddle East & North AfricaMiddle East & North Africa (excluding high income)Middle East & North Africa (IDA & IBRD countries)Middle incomeMoldovaMongoliaMontenegroMoroccoMozambiqueMyanmarNepalNetherlandsNew CaledoniaNew ZealandNicaraguaNigerNigeriaNorth AmericaNorwayOECD membersOmanOther small statesPacific island small statesPakistanPanamaPapua New GuineaParaguayPeruPhilippinesPolandPortugalPost-demographic dividendPre-demographic dividendQatarRomaniaRussian FederationRwandaSamoaSaudi ArabiaSenegalSerbiaSeychellesSierra LeoneSingaporeSlovak RepublicSloveniaSmall statesSomaliaSouth AfricaSouth AsiaSouth Asia (IDA & IBRD)SpainSri LankaSt. LuciaSub-Saharan Africa Sub-Saharan Africa (excluding high income)Sub-Saharan Africa (IDA & IBRD countries)SudanSurinameSwedenSwitzerlandSyrian Arab RepublicTajikistanTanzaniaThailandTogoTrinidad and TobagoTunisiaTurkeyTurkmenistanUgandaUkraineUnited Arab EmiratesUnited KingdomUnited StatesUpper middle incomeUruguayUzbekistanVenezuela, RBVietnamWorldYemen, Rep.ZambiaZimbabwe Timeline:
This timeline shows a graph from 1961 to 2015 of Algeria. No data until 1960. Number of actual observations by date: 51.
Source name:
World Development Indicators
Source organization:
World Bank staff estimates based data from International Monetary Fund's Direction of Trade database.
Categories, topics:
Private Sector, Trade
Last updated:
apr 23, 2017
Indicators value changes by year
Maximum:
34.457
jan 1, 2014
At the date of observation
Value
Absolute change
Change from previous value
jan 1, 1961
0.839
+0.839
0.0%
jan 1, 1962
1.645
+0.806
96.03%
jan 1, 1967
1.014
-0.631
-38.36%
jan 1, 1968
1.687
+0.673
66.34%
jan 1, 1969
1.938
+0.251
14.9%
jan 1, 1970
1.656
-0.282
-14.54%
jan 1, 1971
1.509
-0.147
-8.89%
jan 1, 1972
1.932
+0.423
28.02%
jan 1, 1973
1.922
-0.01
-0.52%
jan 1, 1974
1.674
-0.248
-12.9%
jan 1, 1975
5.471
+3.796
226.75%
jan 1, 1976
0.205
-5.265
-96.25%
jan 1, 1977
0.253
+0.047
23.03%
jan 1, 1978
0.007
-0.246
-97.27%
jan 1, 1979
0.006
-0.001
-7.57%
jan 1, 1980
0.037
+0.031
481.33%
jan 1, 1981
0.055
+0.018
47.5%
jan 1, 1982
0.074
+0.019
35.49%
jan 1, 1983
0.237
+0.163
219.15%
jan 1, 1984
0.127
-0.11
-46.44%
jan 1, 1985
0.624
+0.497
392.12%
jan 1, 1986
0.99
+0.366
58.62%
jan 1, 1987
0.509
-0.481
-48.61%
jan 1, 1988
0.889
+0.38
74.81%
jan 1, 1989
1.67
+0.781
87.85%
jan 1, 1990
1.515
-0.155
-9.3%
jan 1, 1991
2.363
+0.848
56.01%
jan 1, 1992
1.955
-0.407
-17.24%
jan 1, 1993
1.972
+0.016
0.82%
jan 1, 1994
1.598
-0.374
-18.97%
jan 1, 1995
2.66
+1.062
66.48%
jan 1, 1996
2.217
-0.442
-16.63%
jan 1, 1997
2.002
-0.215
-9.7%
jan 1, 1998
1.241
-0.762
-38.03%
jan 1, 1999
1.171
-0.07
-5.66%
jan 1, 2000
1.776
+0.605
51.71%
jan 1, 2001
1.359
-0.417
-23.48%
jan 1, 2002
2.41
+1.051
77.36%
jan 1, 2003
2.525
+0.115
4.76%
jan 1, 2004
2.58
+0.056
2.2%
jan 1, 2005
3.158
+0.578
22.39%
jan 1, 2006
2.25
-0.908
-28.76%
jan 1, 2007
1.835
-0.415
-18.45%
jan 1, 2008
1.687
-0.147
-8.03%
jan 1, 2009
2.898
+1.211
71.75%
jan 1, 2010
2.981
+0.083
2.87%
jan 1, 2011
3.226
+0.245
8.21%
jan 1, 2012
3.192
-0.034
-1.04%
jan 1, 2013
4.08
+0.887
27.8%
jan 1, 2014
34.457
+30.378
744.58%
jan 1, 2015
33.501
-0.957
-2.78%
Ranking of countries by current statistics by years


Comments: