29
/
en
AIzaSyAYiBZKx7MnpbEhh9jyipgxe19OcubqV5w
April 1, 2024
106238
China
CHN
true
2
1
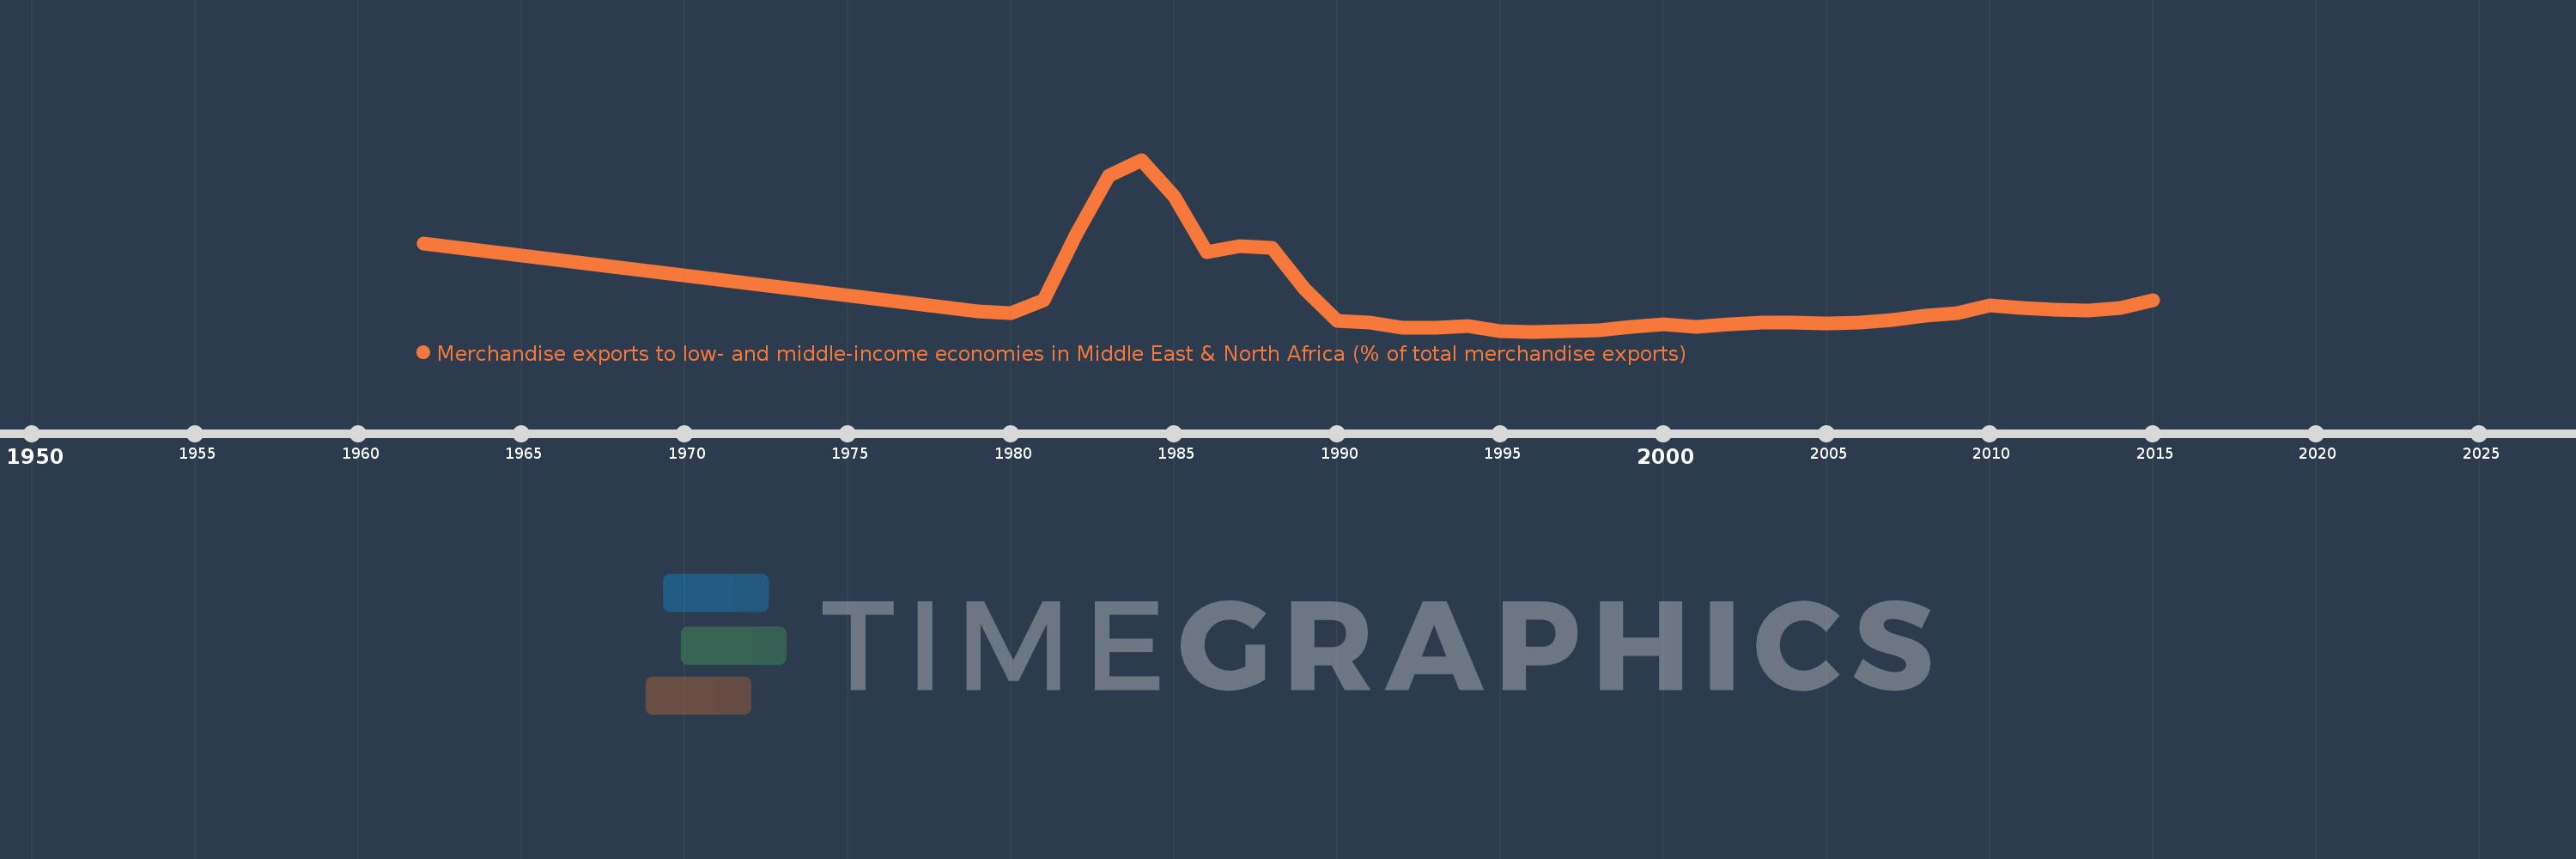
Merchandise exports to low- and middle-income economies in Middle East & North Africa (% of total merchandise exports)
2015,2014,2013,2012,2011,2010,2009,2008,2007,2006,2005,2004,2003,2002,2001,2000,1999,1998,1997,1996,1995,1994,1993,1992,1991,1990,1989,1988,1987,1986,1985,1984,1983,1982,1981,1980,1979,1962
Global statistics library →China →Merchandise exports to low- and middle-income economies in Middle East & North Africa (% of total merchandise exports)
This statistics in other country:
AfghanistanAlbaniaAlgeriaAngolaArab WorldArgentinaArmeniaArubaAustraliaAustriaAzerbaijanBahamas, TheBahrainBangladeshBarbadosBelarusBelgiumBelizeBeninBermudaBoliviaBosnia and HerzegovinaBrazilBrunei DarussalamBulgariaBurkina FasoBurundiCabo VerdeCambodiaCameroonCanadaCaribbean small statesCentral African RepublicCentral Europe and the BalticsChadChileChinaColombiaComorosCongo, Dem. Rep.Congo, Rep.Costa RicaCote d'IvoireCroatiaCubaCyprusCzech RepublicDenmarkDjiboutiDominicaDominican RepublicEarly-demographic dividendEast Asia & PacificEast Asia & Pacific (excluding high income)East Asia & Pacific (IDA & IBRD countries)EcuadorEgypt, Arab Rep.El SalvadorEquatorial GuineaEstoniaEthiopiaEuro areaEurope & Central AsiaEurope & Central Asia (excluding high income)Europe & Central Asia (IDA & IBRD countries)European UnionFijiFinlandFragile and conflict affected situationsFranceGabonGambia, TheGeorgiaGermanyGhanaGreeceGreenlandGrenadaGuatemalaGuineaGuinea-BissauGuyanaHaitiHeavily indebted poor countries (HIPC)High incomeHondurasHong Kong SAR, ChinaHungaryIBRD onlyIcelandIDA & IBRD totalIDA blendIDA onlyIDA totalIndiaIndonesiaIran, Islamic Rep.IraqIrelandIsraelItalyJamaicaJapanJordanKazakhstanKenyaKorea, Dem. People’s Rep.Korea, Rep.KosovoKuwaitKyrgyz RepublicLao PDRLate-demographic dividendLatin America & Caribbean Latin America & Caribbean (excluding high income)Latin America & the Caribbean (IDA & IBRD countries)LatviaLeast developed countries: UN classificationLebanonLiberiaLibyaLithuaniaLow & middle incomeLow incomeLower middle incomeLuxembourgMacao SAR, ChinaMacedonia, FYRMadagascarMalawiMalaysiaMaliMaltaMauritaniaMauritiusMexicoMiddle East & North AfricaMiddle East & North Africa (excluding high income)Middle East & North Africa (IDA & IBRD countries)Middle incomeMoldovaMongoliaMontenegroMoroccoMozambiqueMyanmarNepalNetherlandsNew CaledoniaNew ZealandNicaraguaNigerNigeriaNorth AmericaNorwayOECD membersOmanOther small statesPacific island small statesPakistanPanamaPapua New GuineaParaguayPeruPhilippinesPolandPortugalPost-demographic dividendPre-demographic dividendQatarRomaniaRussian FederationRwandaSamoaSaudi ArabiaSenegalSerbiaSeychellesSierra LeoneSingaporeSlovak RepublicSloveniaSmall statesSomaliaSouth AfricaSouth AsiaSouth Asia (IDA & IBRD)SpainSri LankaSt. LuciaSub-Saharan Africa Sub-Saharan Africa (excluding high income)Sub-Saharan Africa (IDA & IBRD countries)SudanSurinameSwedenSwitzerlandSyrian Arab RepublicTajikistanTanzaniaThailandTogoTrinidad and TobagoTunisiaTurkeyTurkmenistanUgandaUkraineUnited Arab EmiratesUnited KingdomUnited StatesUpper middle incomeUruguayUzbekistanVenezuela, RBVietnamWorldYemen, Rep.ZambiaZimbabwe Timeline:
This timeline shows a graph from 1962 to 2015 of China. No data until 1961. Number of actual observations by date: 38.
Source name:
World Development Indicators
Source organization:
World Bank staff estimates based data from International Monetary Fund's Direction of Trade database.
Categories, topics:
Private Sector, Trade
Last updated:
apr 23, 2017
Indicators value changes by year
Maximum:
10.987
jan 1, 1984
At the date of observation
Value
Absolute change
Change from previous value
jan 1, 1962
6.13
+6.13
0.0%
jan 1, 1979
2.176
-3.954
-64.5%
jan 1, 1980
2.048
-0.128
-5.9%
jan 1, 1981
2.813
+0.765
37.36%
jan 1, 1982
6.654
+3.841
136.56%
jan 1, 1983
10.086
+3.432
51.58%
jan 1, 1984
10.987
+0.901
8.94%
jan 1, 1985
8.84
-2.147
-19.54%
jan 1, 1986
5.61
-3.23
-36.54%
jan 1, 1987
5.953
+0.343
6.11%
jan 1, 1988
5.843
-0.11
-1.85%
jan 1, 1989
3.49
-2.353
-40.27%
jan 1, 1990
1.599
-1.891
-54.18%
jan 1, 1991
1.536
-0.063
-3.92%
jan 1, 1992
1.244
-0.292
-19.04%
jan 1, 1993
1.236
-0.008
-0.66%
jan 1, 1994
1.315
+0.079
6.41%
jan 1, 1995
1.013
-0.301
-22.93%
jan 1, 1996
0.997
-0.016
-1.61%
jan 1, 1997
1.003
+0.006
0.55%
jan 1, 1998
1.047
+0.045
4.44%
jan 1, 1999
1.289
+0.242
23.07%
jan 1, 2000
1.425
+0.136
10.55%
jan 1, 2001
1.292
-0.132
-9.28%
jan 1, 2002
1.42
+0.127
9.86%
jan 1, 2003
1.542
+0.122
8.58%
jan 1, 2004
1.537
-0.004
-0.28%
jan 1, 2005
1.492
-0.045
-2.93%
jan 1, 2006
1.543
+0.05
3.37%
jan 1, 2007
1.684
+0.142
9.19%
jan 1, 2008
1.923
+0.239
14.19%
jan 1, 2009
2.094
+0.171
8.88%
jan 1, 2010
2.545
+0.451
21.53%
jan 1, 2011
2.384
-0.161
-6.33%
jan 1, 2012
2.281
-0.102
-4.3%
jan 1, 2013
2.235
-0.047
-2.05%
jan 1, 2014
2.391
+0.156
6.98%
jan 1, 2015
2.845
+0.454
18.98%
Ranking of countries by current statistics by years


Comments: