29
/
en
AIzaSyAYiBZKx7MnpbEhh9jyipgxe19OcubqV5w
April 1, 2024
227641
Qatar
QAT
true
2
1
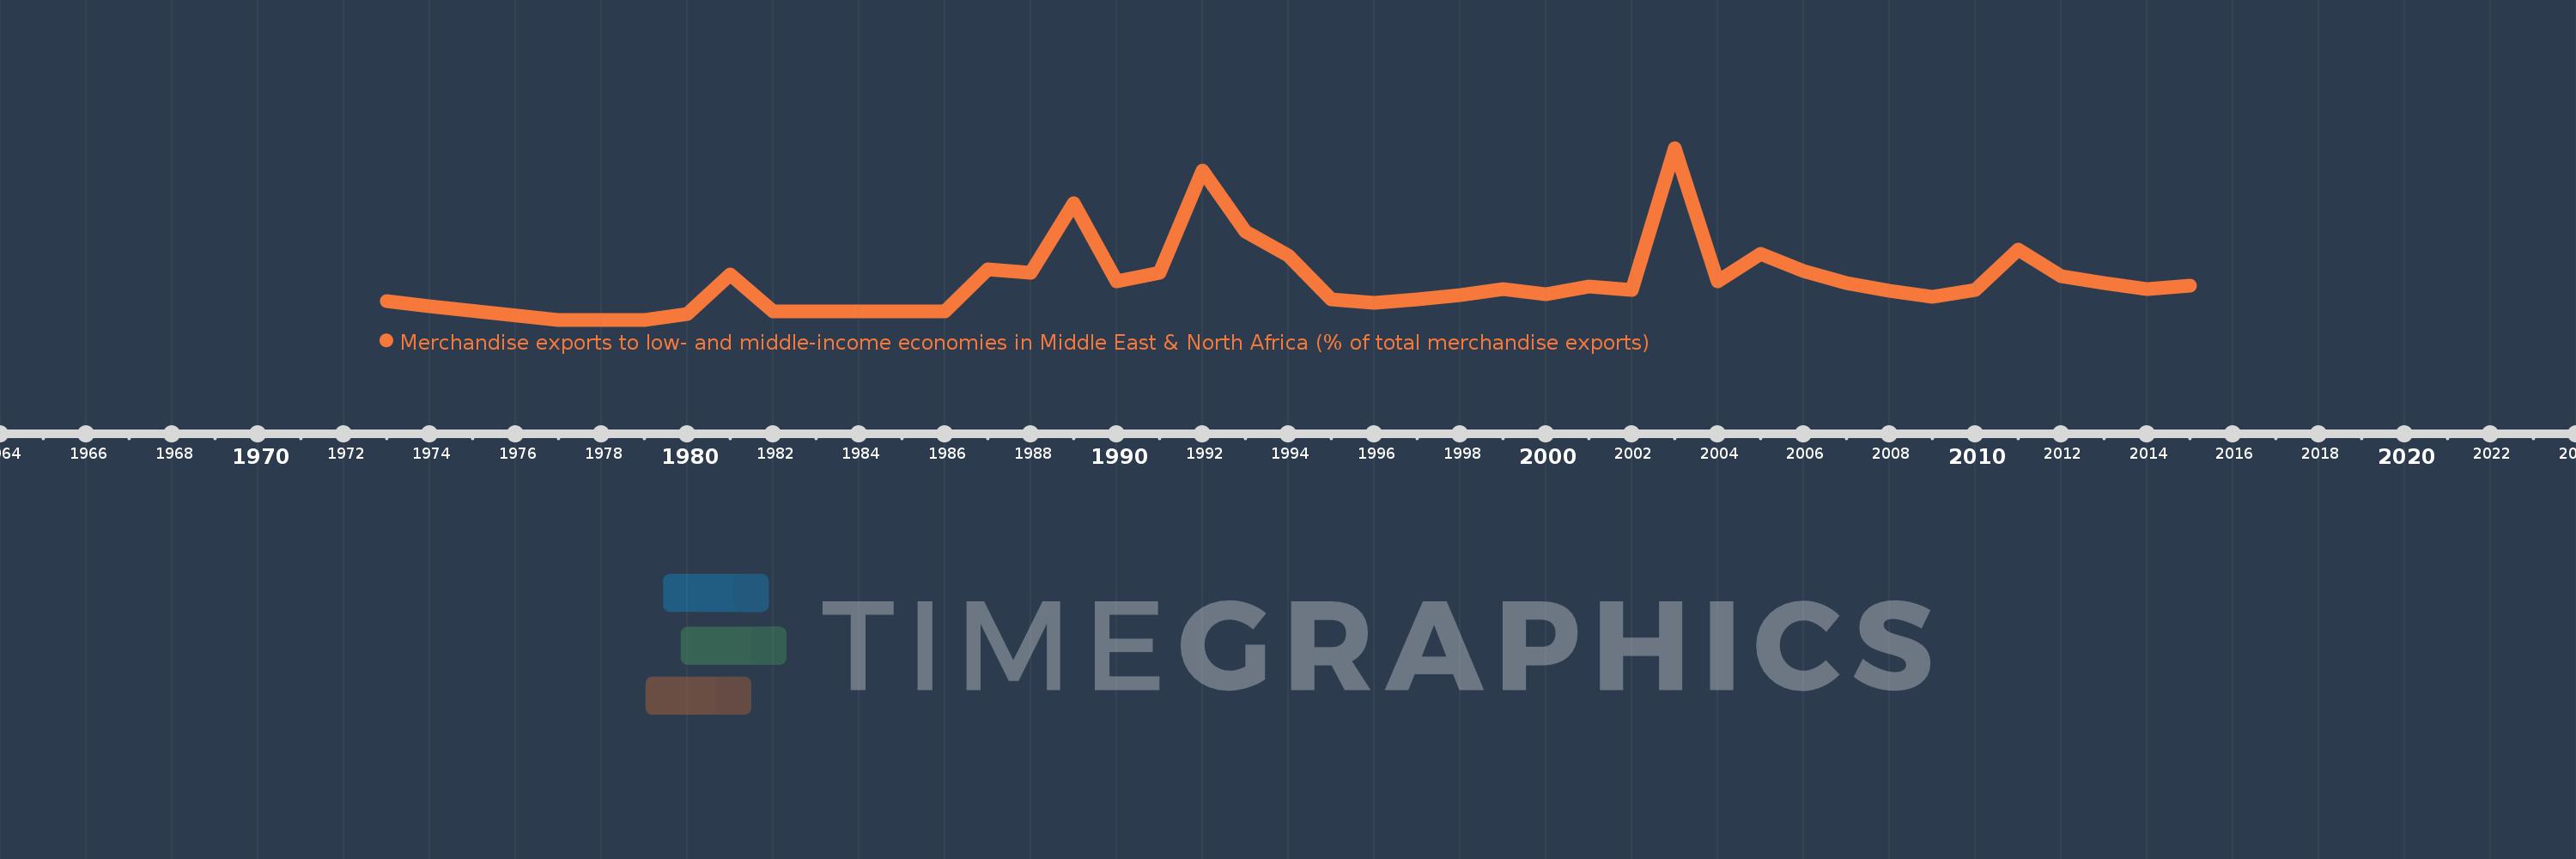
Merchandise exports to low- and middle-income economies in Middle East & North Africa (% of total merchandise exports)
2015,2014,2013,2012,2011,2010,2009,2008,2007,2006,2005,2004,2003,2002,2001,2000,1999,1998,1997,1996,1995,1994,1993,1992,1991,1990,1989,1988,1987,1986,1985,1984,1983,1982,1981,1980,1979,1977,1974,1973
Global statistics library →Qatar →Merchandise exports to low- and middle-income economies in Middle East & North Africa (% of total merchandise exports)
This statistics in other country:
AfghanistanAlbaniaAlgeriaAngolaArab WorldArgentinaArmeniaArubaAustraliaAustriaAzerbaijanBahamas, TheBahrainBangladeshBarbadosBelarusBelgiumBelizeBeninBermudaBoliviaBosnia and HerzegovinaBrazilBrunei DarussalamBulgariaBurkina FasoBurundiCabo VerdeCambodiaCameroonCanadaCaribbean small statesCentral African RepublicCentral Europe and the BalticsChadChileChinaColombiaComorosCongo, Dem. Rep.Congo, Rep.Costa RicaCote d'IvoireCroatiaCubaCyprusCzech RepublicDenmarkDjiboutiDominicaDominican RepublicEarly-demographic dividendEast Asia & PacificEast Asia & Pacific (excluding high income)East Asia & Pacific (IDA & IBRD countries)EcuadorEgypt, Arab Rep.El SalvadorEquatorial GuineaEstoniaEthiopiaEuro areaEurope & Central AsiaEurope & Central Asia (excluding high income)Europe & Central Asia (IDA & IBRD countries)European UnionFijiFinlandFragile and conflict affected situationsFranceGabonGambia, TheGeorgiaGermanyGhanaGreeceGreenlandGrenadaGuatemalaGuineaGuinea-BissauGuyanaHaitiHeavily indebted poor countries (HIPC)High incomeHondurasHong Kong SAR, ChinaHungaryIBRD onlyIcelandIDA & IBRD totalIDA blendIDA onlyIDA totalIndiaIndonesiaIran, Islamic Rep.IraqIrelandIsraelItalyJamaicaJapanJordanKazakhstanKenyaKorea, Dem. People’s Rep.Korea, Rep.KosovoKuwaitKyrgyz RepublicLao PDRLate-demographic dividendLatin America & Caribbean Latin America & Caribbean (excluding high income)Latin America & the Caribbean (IDA & IBRD countries)LatviaLeast developed countries: UN classificationLebanonLiberiaLibyaLithuaniaLow & middle incomeLow incomeLower middle incomeLuxembourgMacao SAR, ChinaMacedonia, FYRMadagascarMalawiMalaysiaMaliMaltaMauritaniaMauritiusMexicoMiddle East & North AfricaMiddle East & North Africa (excluding high income)Middle East & North Africa (IDA & IBRD countries)Middle incomeMoldovaMongoliaMontenegroMoroccoMozambiqueMyanmarNepalNetherlandsNew CaledoniaNew ZealandNicaraguaNigerNigeriaNorth AmericaNorwayOECD membersOmanOther small statesPacific island small statesPakistanPanamaPapua New GuineaParaguayPeruPhilippinesPolandPortugalPost-demographic dividendPre-demographic dividendQatarRomaniaRussian FederationRwandaSamoaSaudi ArabiaSenegalSerbiaSeychellesSierra LeoneSingaporeSlovak RepublicSloveniaSmall statesSomaliaSouth AfricaSouth AsiaSouth Asia (IDA & IBRD)SpainSri LankaSt. LuciaSub-Saharan Africa Sub-Saharan Africa (excluding high income)Sub-Saharan Africa (IDA & IBRD countries)SudanSurinameSwedenSwitzerlandSyrian Arab RepublicTajikistanTanzaniaThailandTogoTrinidad and TobagoTunisiaTurkeyTurkmenistanUgandaUkraineUnited Arab EmiratesUnited KingdomUnited StatesUpper middle incomeUruguayUzbekistanVenezuela, RBVietnamWorldYemen, Rep.ZambiaZimbabwe Timeline:
This timeline shows a graph from 1973 to 2015 of Qatar. No data until 1972. Number of actual observations by date: 40.
Source name:
World Development Indicators
Source organization:
World Bank staff estimates based data from International Monetary Fund's Direction of Trade database.
Categories, topics:
Private Sector, Trade
Last updated:
apr 23, 2017
Indicators value changes by year
At the date of observation
Value
Absolute change
Change from previous value
jan 1, 1973
0.331
+0.331
0.0%
jan 1, 1974
0.244
-0.087
-26.28%
jan 1, 1977
0.0
-0.244
-100.0%
jan 1, 1981
0.808
+0.708
705.28%
jan 1, 1982
0.147
-0.661
-81.86%
jan 1, 1983
0.147
0.0
0.0%
jan 1, 1984
0.147
+0.0
0.0%
jan 1, 1985
0.147
0.0
0.0%
jan 1, 1986
0.147
+0.0
0.0%
jan 1, 1987
0.911
+0.764
521.36%
jan 1, 1988
0.848
-0.062
-6.86%
jan 1, 1989
2.091
+1.243
146.52%
jan 1, 1990
0.686
-1.405
-67.18%
jan 1, 1991
0.849
+0.163
23.75%
jan 1, 1992
2.667
+1.817
213.95%
jan 1, 1993
1.583
-1.084
-40.63%
jan 1, 1994
1.147
-0.436
-27.53%
jan 1, 1995
0.358
-0.79
-68.84%
jan 1, 1996
0.303
-0.054
-15.11%
jan 1, 1997
0.367
+0.063
20.88%
jan 1, 1998
0.443
+0.076
20.81%
jan 1, 1999
0.55
+0.107
24.07%
jan 1, 2000
0.459
-0.091
-16.46%
jan 1, 2001
0.592
+0.132
28.84%
jan 1, 2002
0.534
-0.058
-9.75%
jan 1, 2003
3.078
+2.544
476.19%
jan 1, 2004
0.693
-2.384
-77.48%
jan 1, 2005
1.176
+0.483
69.69%
jan 1, 2006
0.866
-0.31
-26.39%
jan 1, 2007
0.657
-0.209
-24.16%
jan 1, 2008
0.521
-0.136
-20.64%
jan 1, 2009
0.415
-0.107
-20.46%
jan 1, 2010
0.532
+0.118
28.39%
jan 1, 2011
1.251
+0.718
134.97%
jan 1, 2012
0.778
-0.472
-37.76%
jan 1, 2013
0.652
-0.127
-16.27%
jan 1, 2014
0.555
-0.097
-14.86%
jan 1, 2015
0.611
+0.056
10.18%
Ranking of countries by current statistics by years


Comments: