29
/
en
AIzaSyAYiBZKx7MnpbEhh9jyipgxe19OcubqV5w
April 1, 2024
102679
Central African Republic
CAF
true
2
1
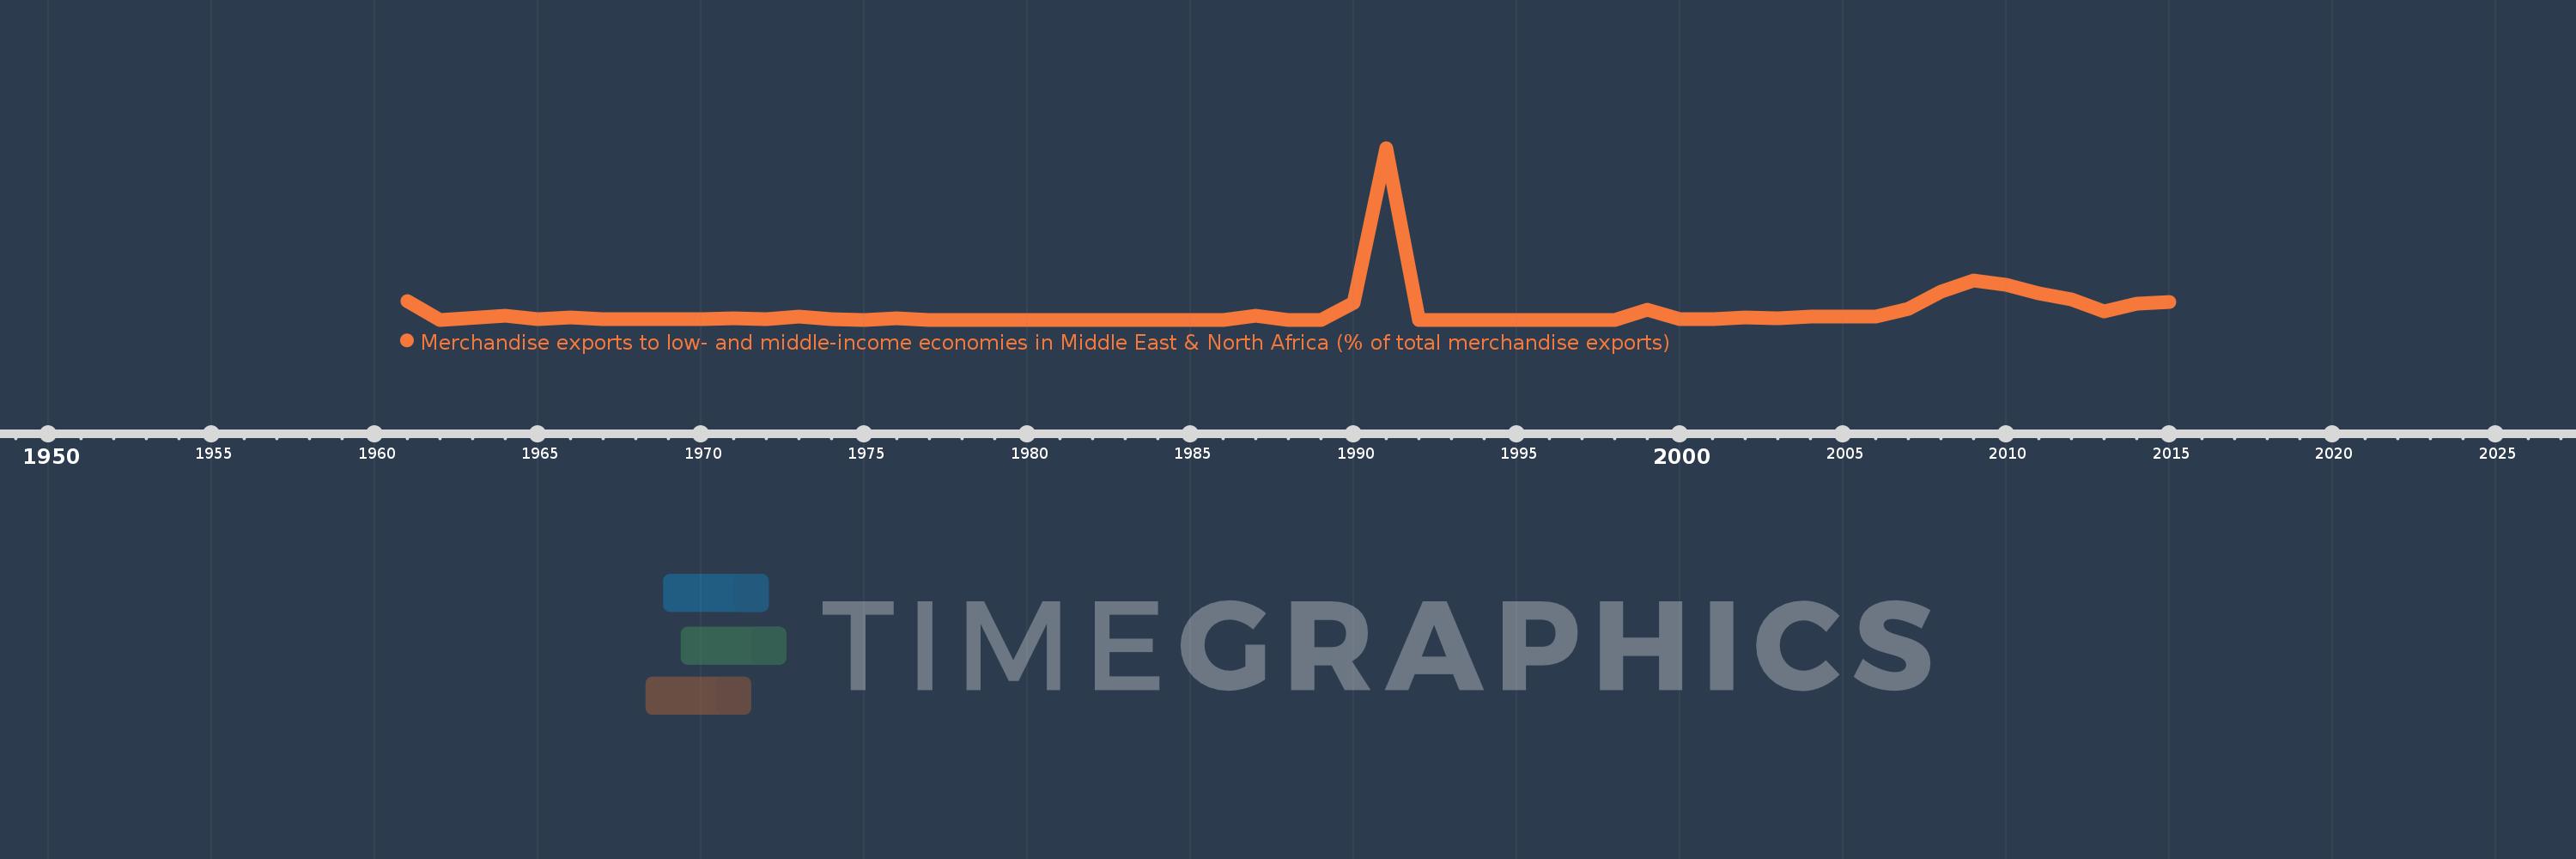
Merchandise exports to low- and middle-income economies in Middle East & North Africa (% of total merchandise exports)
2015,2014,2013,2012,2011,2010,2009,2008,2007,2006,2005,2004,2003,2002,2001,2000,1999,1998,1997,1996,1995,1994,1993,1992,1991,1990,1989,1988,1987,1986,1985,1984,1983,1982,1981,1980,1979,1978,1977,1976,1975,1974,1973,1972,1971,1970,1969,1968,1967,1966,1965,1964,1962,1961
This statistics in other country:
AfghanistanAlbaniaAlgeriaAngolaArab WorldArgentinaArmeniaArubaAustraliaAustriaAzerbaijanBahamas, TheBahrainBangladeshBarbadosBelarusBelgiumBelizeBeninBermudaBoliviaBosnia and HerzegovinaBrazilBrunei DarussalamBulgariaBurkina FasoBurundiCabo VerdeCambodiaCameroonCanadaCaribbean small statesCentral African RepublicCentral Europe and the BalticsChadChileChinaColombiaComorosCongo, Dem. Rep.Congo, Rep.Costa RicaCote d'IvoireCroatiaCubaCyprusCzech RepublicDenmarkDjiboutiDominicaDominican RepublicEarly-demographic dividendEast Asia & PacificEast Asia & Pacific (excluding high income)East Asia & Pacific (IDA & IBRD countries)EcuadorEgypt, Arab Rep.El SalvadorEquatorial GuineaEstoniaEthiopiaEuro areaEurope & Central AsiaEurope & Central Asia (excluding high income)Europe & Central Asia (IDA & IBRD countries)European UnionFijiFinlandFragile and conflict affected situationsFranceGabonGambia, TheGeorgiaGermanyGhanaGreeceGreenlandGrenadaGuatemalaGuineaGuinea-BissauGuyanaHaitiHeavily indebted poor countries (HIPC)High incomeHondurasHong Kong SAR, ChinaHungaryIBRD onlyIcelandIDA & IBRD totalIDA blendIDA onlyIDA totalIndiaIndonesiaIran, Islamic Rep.IraqIrelandIsraelItalyJamaicaJapanJordanKazakhstanKenyaKorea, Dem. People’s Rep.Korea, Rep.KosovoKuwaitKyrgyz RepublicLao PDRLate-demographic dividendLatin America & Caribbean Latin America & Caribbean (excluding high income)Latin America & the Caribbean (IDA & IBRD countries)LatviaLeast developed countries: UN classificationLebanonLiberiaLibyaLithuaniaLow & middle incomeLow incomeLower middle incomeLuxembourgMacao SAR, ChinaMacedonia, FYRMadagascarMalawiMalaysiaMaliMaltaMauritaniaMauritiusMexicoMiddle East & North AfricaMiddle East & North Africa (excluding high income)Middle East & North Africa (IDA & IBRD countries)Middle incomeMoldovaMongoliaMontenegroMoroccoMozambiqueMyanmarNepalNetherlandsNew CaledoniaNew ZealandNicaraguaNigerNigeriaNorth AmericaNorwayOECD membersOmanOther small statesPacific island small statesPakistanPanamaPapua New GuineaParaguayPeruPhilippinesPolandPortugalPost-demographic dividendPre-demographic dividendQatarRomaniaRussian FederationRwandaSamoaSaudi ArabiaSenegalSerbiaSeychellesSierra LeoneSingaporeSlovak RepublicSloveniaSmall statesSomaliaSouth AfricaSouth AsiaSouth Asia (IDA & IBRD)SpainSri LankaSt. LuciaSub-Saharan Africa Sub-Saharan Africa (excluding high income)Sub-Saharan Africa (IDA & IBRD countries)SudanSurinameSwedenSwitzerlandSyrian Arab RepublicTajikistanTanzaniaThailandTogoTrinidad and TobagoTunisiaTurkeyTurkmenistanUgandaUkraineUnited Arab EmiratesUnited KingdomUnited StatesUpper middle incomeUruguayUzbekistanVenezuela, RBVietnamWorldYemen, Rep.ZambiaZimbabwe Timeline:
This timeline shows a graph from 1961 to 2015 of Central African Republic. No data until 1960. Number of actual observations by date: 54.
Source name:
World Development Indicators
Source organization:
World Bank staff estimates based data from International Monetary Fund's Direction of Trade database.
Categories, topics:
Private Sector, Trade
Last updated:
apr 23, 2017
Indicators value changes by year
At the date of observation
Value
Absolute change
Change from previous value
jan 1, 1961
6.475
+6.475
0.0%
jan 1, 1962
0.0
-6.475
-100.0%
jan 1, 1964
1.364
+1.364
%
jan 1, 1965
0.346
-1.018
-74.63%
jan 1, 1966
0.766
+0.42
121.46%
jan 1, 1967
0.324
-0.443
-57.77%
jan 1, 1968
0.346
+0.022
6.92%
jan 1, 1969
0.284
-0.062
-17.9%
jan 1, 1970
0.149
-0.135
-47.59%
jan 1, 1971
0.364
+0.215
144.38%
jan 1, 1972
0.202
-0.162
-44.44%
jan 1, 1973
0.953
+0.751
371.57%
jan 1, 1974
0.099
-0.855
-89.67%
jan 1, 1975
0.056
-0.043
-43.43%
jan 1, 1976
0.488
+0.432
774.82%
jan 1, 1977
0.0
-0.488
-100.0%
jan 1, 1979
0.008
+0.008
%
jan 1, 1980
0.0
-0.008
-100.0%
jan 1, 1987
1.455
+1.455
%
jan 1, 1988
0.0
-1.455
-100.0%
jan 1, 1990
5.859
+5.859
%
jan 1, 1991
59.1
+53.241
908.67%
jan 1, 1992
0.0
-59.1
-100.0%
jan 1, 1993
0.038
+0.038
%
jan 1, 1994
0.016
-0.021
-57.09%
jan 1, 1995
0.002
-0.014
-88.28%
jan 1, 1996
0.016
+0.014
762.03%
jan 1, 1997
0.0
-0.016
-100.0%
jan 1, 1998
0.026
+0.026
%
jan 1, 1999
3.593
+3.567
13.66K%
jan 1, 2000
0.19
-3.404
-94.72%
jan 1, 2001
0.299
+0.109
57.63%
jan 1, 2002
0.724
+0.424
141.74%
jan 1, 2003
0.449
-0.275
-37.95%
jan 1, 2004
1.13
+0.681
151.77%
jan 1, 2005
1.032
-0.098
-8.69%
jan 1, 2006
1.168
+0.136
13.15%
jan 1, 2007
3.826
+2.658
227.55%
jan 1, 2008
9.626
+5.8
151.59%
jan 1, 2009
13.641
+4.016
41.72%
jan 1, 2010
11.925
-1.716
-12.58%
jan 1, 2011
9.216
-2.709
-22.72%
jan 1, 2012
7.113
-2.103
-22.82%
jan 1, 2013
2.927
-4.186
-58.85%
jan 1, 2014
5.511
+2.584
88.28%
jan 1, 2015
6.208
+0.697
12.65%
Ranking of countries by current statistics by years


Comments: