29
/
en
AIzaSyAYiBZKx7MnpbEhh9jyipgxe19OcubqV5w
April 1, 2024
31817
Europe & Central Asia (excluding high income)
ECA
false
2
1
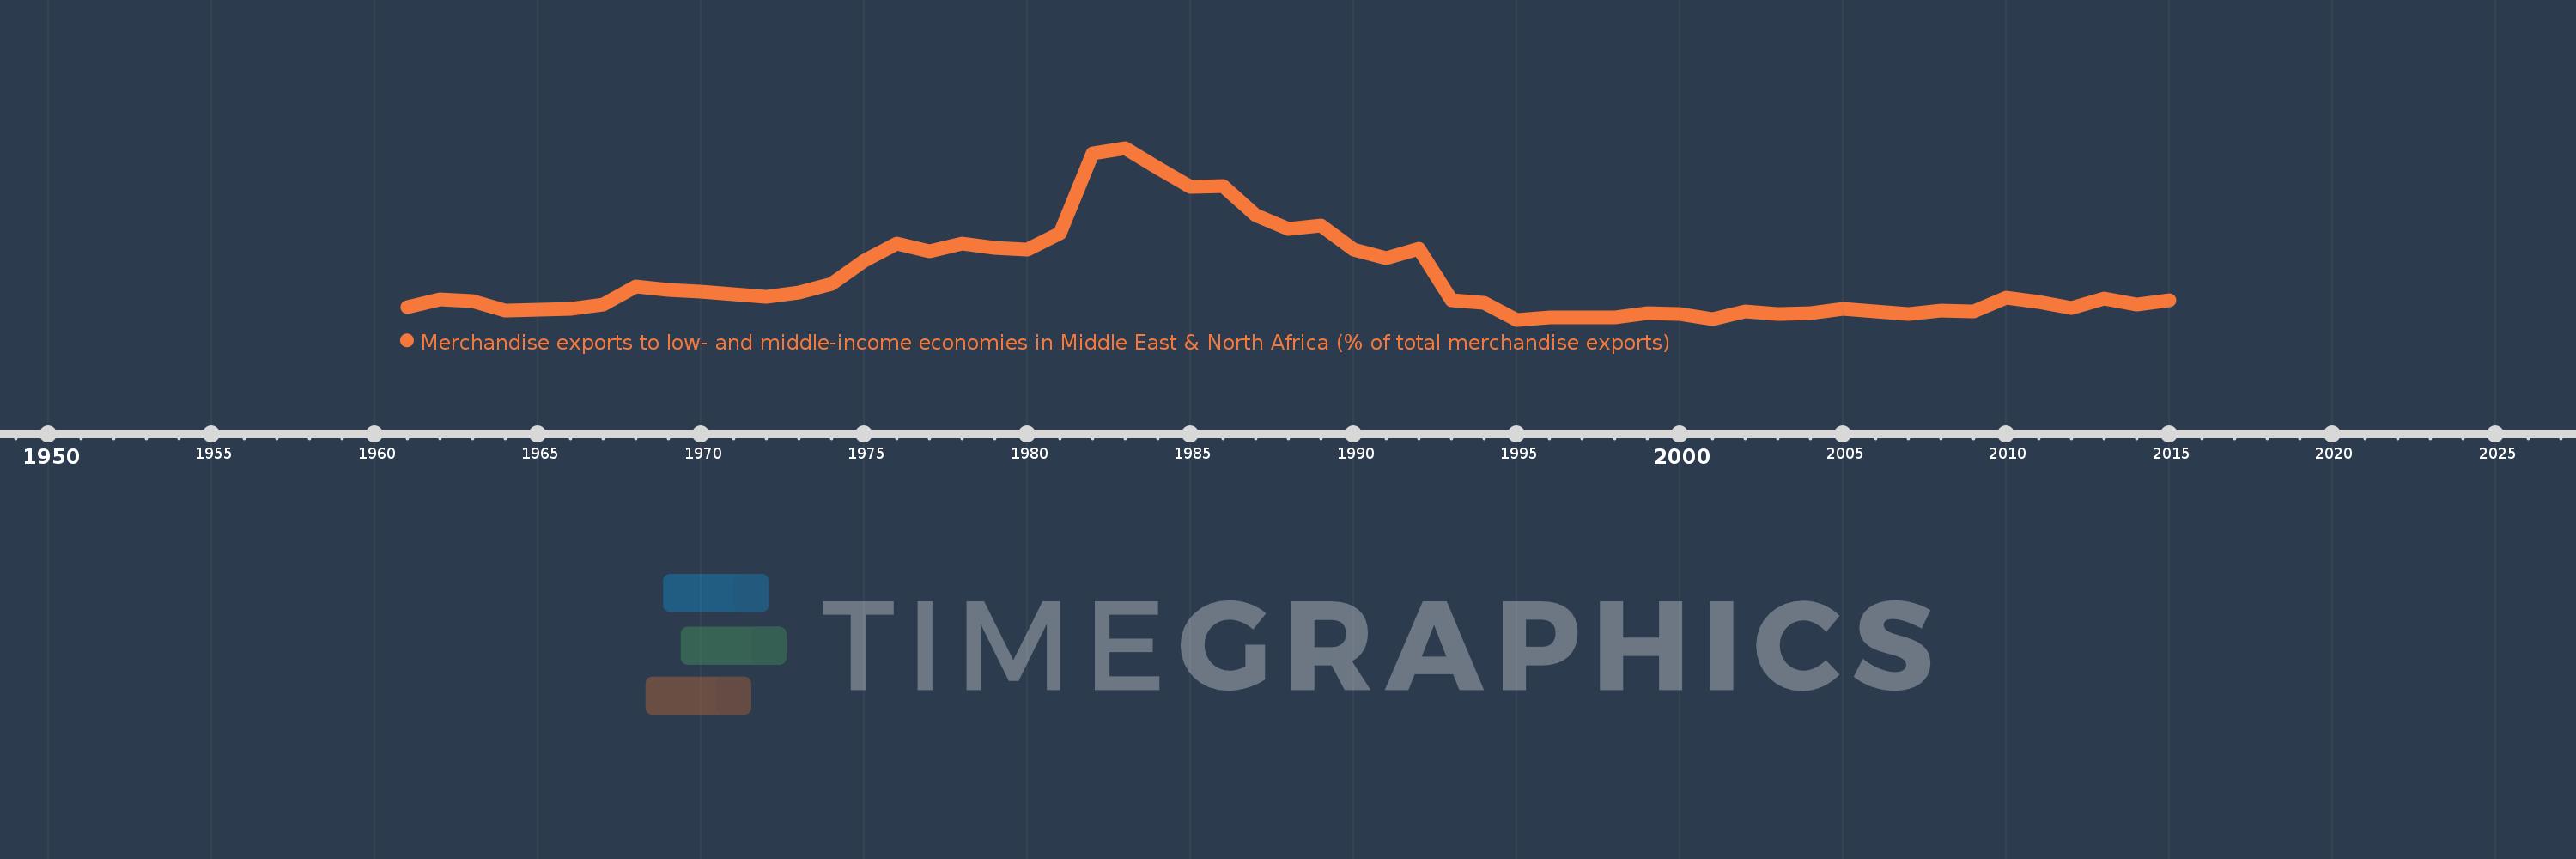
Merchandise exports to low- and middle-income economies in Middle East & North Africa (% of total merchandise exports)
2015,2014,2013,2012,2011,2010,2009,2008,2007,2006,2005,2004,2003,2002,2001,2000,1999,1998,1997,1996,1995,1994,1993,1992,1991,1990,1989,1988,1987,1986,1985,1984,1983,1982,1981,1980,1979,1978,1977,1976,1975,1974,1973,1972,1971,1970,1969,1968,1967,1966,1965,1964,1963,1962,1961
This statistics in other country:
AfghanistanAlbaniaAlgeriaAngolaArab WorldArgentinaArmeniaArubaAustraliaAustriaAzerbaijanBahamas, TheBahrainBangladeshBarbadosBelarusBelgiumBelizeBeninBermudaBoliviaBosnia and HerzegovinaBrazilBrunei DarussalamBulgariaBurkina FasoBurundiCabo VerdeCambodiaCameroonCanadaCaribbean small statesCentral African RepublicCentral Europe and the BalticsChadChileChinaColombiaComorosCongo, Dem. Rep.Congo, Rep.Costa RicaCote d'IvoireCroatiaCubaCyprusCzech RepublicDenmarkDjiboutiDominicaDominican RepublicEarly-demographic dividendEast Asia & PacificEast Asia & Pacific (excluding high income)East Asia & Pacific (IDA & IBRD countries)EcuadorEgypt, Arab Rep.El SalvadorEquatorial GuineaEstoniaEthiopiaEuro areaEurope & Central AsiaEurope & Central Asia (excluding high income)Europe & Central Asia (IDA & IBRD countries)European UnionFijiFinlandFragile and conflict affected situationsFranceGabonGambia, TheGeorgiaGermanyGhanaGreeceGreenlandGrenadaGuatemalaGuineaGuinea-BissauGuyanaHaitiHeavily indebted poor countries (HIPC)High incomeHondurasHong Kong SAR, ChinaHungaryIBRD onlyIcelandIDA & IBRD totalIDA blendIDA onlyIDA totalIndiaIndonesiaIran, Islamic Rep.IraqIrelandIsraelItalyJamaicaJapanJordanKazakhstanKenyaKorea, Dem. People’s Rep.Korea, Rep.KosovoKuwaitKyrgyz RepublicLao PDRLate-demographic dividendLatin America & Caribbean Latin America & Caribbean (excluding high income)Latin America & the Caribbean (IDA & IBRD countries)LatviaLeast developed countries: UN classificationLebanonLiberiaLibyaLithuaniaLow & middle incomeLow incomeLower middle incomeLuxembourgMacao SAR, ChinaMacedonia, FYRMadagascarMalawiMalaysiaMaliMaltaMauritaniaMauritiusMexicoMiddle East & North AfricaMiddle East & North Africa (excluding high income)Middle East & North Africa (IDA & IBRD countries)Middle incomeMoldovaMongoliaMontenegroMoroccoMozambiqueMyanmarNepalNetherlandsNew CaledoniaNew ZealandNicaraguaNigerNigeriaNorth AmericaNorwayOECD membersOmanOther small statesPacific island small statesPakistanPanamaPapua New GuineaParaguayPeruPhilippinesPolandPortugalPost-demographic dividendPre-demographic dividendQatarRomaniaRussian FederationRwandaSamoaSaudi ArabiaSenegalSerbiaSeychellesSierra LeoneSingaporeSlovak RepublicSloveniaSmall statesSomaliaSouth AfricaSouth AsiaSouth Asia (IDA & IBRD)SpainSri LankaSt. LuciaSub-Saharan Africa Sub-Saharan Africa (excluding high income)Sub-Saharan Africa (IDA & IBRD countries)SudanSurinameSwedenSwitzerlandSyrian Arab RepublicTajikistanTanzaniaThailandTogoTrinidad and TobagoTunisiaTurkeyTurkmenistanUgandaUkraineUnited Arab EmiratesUnited KingdomUnited StatesUpper middle incomeUruguayUzbekistanVenezuela, RBVietnamWorldYemen, Rep.ZambiaZimbabwe Timeline:
This timeline shows a graph from 1961 to 2015 of Europe & Central Asia (excluding high income). No data until 1960. Number of actual observations by date: 55.
Source name:
World Development Indicators
Source organization:
World Bank staff estimates based data from International Monetary Fund's Direction of Trade database.
Categories, topics:
Private Sector, Trade
Last updated:
apr 23, 2017
Indicators value changes by year
Maximum:
24.755
jan 1, 1983
At the date of observation
Value
Absolute change
Change from previous value
jan 1, 1961
4.677
+4.677
0.0%
jan 1, 1962
5.637
+0.961
20.54%
jan 1, 1963
5.39
-0.248
-4.39%
jan 1, 1964
4.267
-1.123
-20.83%
jan 1, 1965
4.389
+0.122
2.87%
jan 1, 1966
4.455
+0.066
1.49%
jan 1, 1967
4.993
+0.538
12.07%
jan 1, 1968
7.332
+2.339
46.85%
jan 1, 1969
6.841
-0.491
-6.69%
jan 1, 1970
6.609
-0.233
-3.4%
jan 1, 1971
6.318
-0.29
-4.39%
jan 1, 1972
5.993
-0.325
-5.14%
jan 1, 1973
6.566
+0.573
9.57%
jan 1, 1974
7.645
+1.078
16.42%
jan 1, 1975
10.498
+2.854
37.33%
jan 1, 1976
12.653
+2.155
20.52%
jan 1, 1977
11.682
-0.971
-7.67%
jan 1, 1978
12.66
+0.978
8.37%
jan 1, 1979
12.179
-0.481
-3.8%
jan 1, 1980
11.932
-0.247
-2.03%
jan 1, 1981
14.014
+2.083
17.45%
jan 1, 1982
24.024
+10.01
71.42%
jan 1, 1983
24.755
+0.731
3.04%
jan 1, 1984
22.243
-2.512
-10.15%
jan 1, 1985
19.828
-2.415
-10.86%
jan 1, 1986
19.984
+0.156
0.78%
jan 1, 1987
16.3
-3.683
-18.43%
jan 1, 1988
14.578
-1.722
-10.57%
jan 1, 1989
14.997
+0.419
2.87%
jan 1, 1990
11.976
-3.021
-20.14%
jan 1, 1991
10.88
-1.096
-9.15%
jan 1, 1992
12.045
+1.165
10.71%
jan 1, 1993
5.546
-6.499
-53.95%
jan 1, 1994
5.249
-0.297
-5.35%
jan 1, 1995
3.092
-2.157
-41.09%
jan 1, 1996
3.397
+0.305
9.86%
jan 1, 1997
3.41
+0.013
0.38%
jan 1, 1998
3.43
+0.019
0.57%
jan 1, 1999
3.892
+0.463
13.49%
jan 1, 2000
3.832
-0.06
-1.54%
jan 1, 2001
3.136
-0.697
-18.18%
jan 1, 2002
4.103
+0.967
30.84%
jan 1, 2003
3.775
-0.328
-7.99%
jan 1, 2004
3.906
+0.131
3.47%
jan 1, 2005
4.464
+0.558
14.29%
jan 1, 2006
4.121
-0.343
-7.68%
jan 1, 2007
3.828
-0.292
-7.09%
jan 1, 2008
4.266
+0.437
11.41%
jan 1, 2009
4.167
-0.098
-2.31%
jan 1, 2010
5.84
+1.673
40.14%
jan 1, 2011
5.299
-0.541
-9.27%
jan 1, 2012
4.596
-0.703
-13.26%
jan 1, 2013
5.816
+1.22
26.55%
jan 1, 2014
5.005
-0.811
-13.95%
jan 1, 2015
5.596
+0.591
11.81%
Ranking of countries by current statistics by years


Comments: