29
/
en
AIzaSyAYiBZKx7MnpbEhh9jyipgxe19OcubqV5w
April 1, 2024
167772
Kenya
KEN
true
2
1
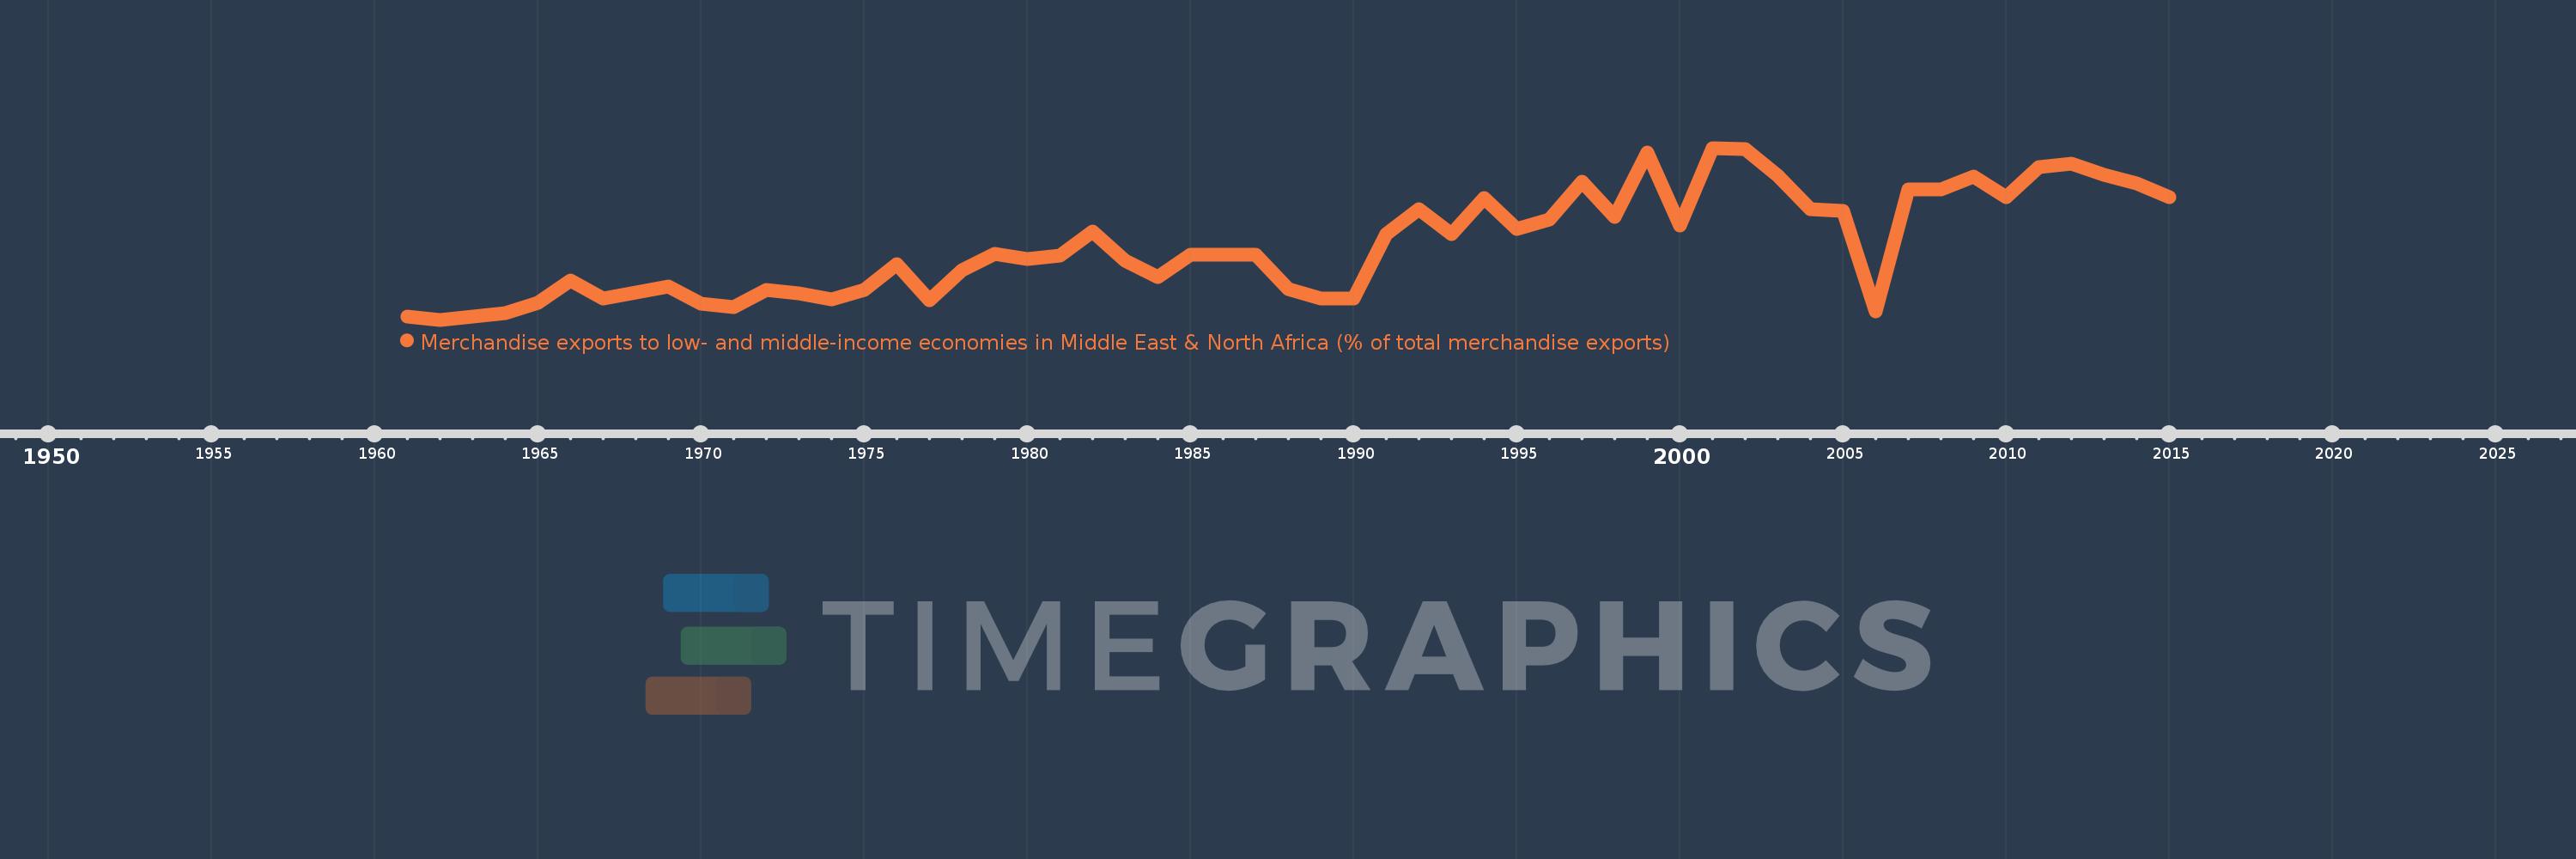
Merchandise exports to low- and middle-income economies in Middle East & North Africa (% of total merchandise exports)
2015,2014,2013,2012,2011,2010,2009,2008,2007,2006,2005,2004,2003,2002,2001,2000,1999,1998,1997,1996,1995,1994,1993,1992,1991,1990,1989,1988,1987,1986,1985,1984,1983,1982,1981,1980,1979,1978,1977,1976,1975,1974,1973,1972,1971,1970,1969,1968,1967,1966,1965,1964,1963,1962,1961
Global statistics library →Kenya →Merchandise exports to low- and middle-income economies in Middle East & North Africa (% of total merchandise exports)
This statistics in other country:
AfghanistanAlbaniaAlgeriaAngolaArab WorldArgentinaArmeniaArubaAustraliaAustriaAzerbaijanBahamas, TheBahrainBangladeshBarbadosBelarusBelgiumBelizeBeninBermudaBoliviaBosnia and HerzegovinaBrazilBrunei DarussalamBulgariaBurkina FasoBurundiCabo VerdeCambodiaCameroonCanadaCaribbean small statesCentral African RepublicCentral Europe and the BalticsChadChileChinaColombiaComorosCongo, Dem. Rep.Congo, Rep.Costa RicaCote d'IvoireCroatiaCubaCyprusCzech RepublicDenmarkDjiboutiDominicaDominican RepublicEarly-demographic dividendEast Asia & PacificEast Asia & Pacific (excluding high income)East Asia & Pacific (IDA & IBRD countries)EcuadorEgypt, Arab Rep.El SalvadorEquatorial GuineaEstoniaEthiopiaEuro areaEurope & Central AsiaEurope & Central Asia (excluding high income)Europe & Central Asia (IDA & IBRD countries)European UnionFijiFinlandFragile and conflict affected situationsFranceGabonGambia, TheGeorgiaGermanyGhanaGreeceGreenlandGrenadaGuatemalaGuineaGuinea-BissauGuyanaHaitiHeavily indebted poor countries (HIPC)High incomeHondurasHong Kong SAR, ChinaHungaryIBRD onlyIcelandIDA & IBRD totalIDA blendIDA onlyIDA totalIndiaIndonesiaIran, Islamic Rep.IraqIrelandIsraelItalyJamaicaJapanJordanKazakhstanKenyaKorea, Dem. People’s Rep.Korea, Rep.KosovoKuwaitKyrgyz RepublicLao PDRLate-demographic dividendLatin America & Caribbean Latin America & Caribbean (excluding high income)Latin America & the Caribbean (IDA & IBRD countries)LatviaLeast developed countries: UN classificationLebanonLiberiaLibyaLithuaniaLow & middle incomeLow incomeLower middle incomeLuxembourgMacao SAR, ChinaMacedonia, FYRMadagascarMalawiMalaysiaMaliMaltaMauritaniaMauritiusMexicoMiddle East & North AfricaMiddle East & North Africa (excluding high income)Middle East & North Africa (IDA & IBRD countries)Middle incomeMoldovaMongoliaMontenegroMoroccoMozambiqueMyanmarNepalNetherlandsNew CaledoniaNew ZealandNicaraguaNigerNigeriaNorth AmericaNorwayOECD membersOmanOther small statesPacific island small statesPakistanPanamaPapua New GuineaParaguayPeruPhilippinesPolandPortugalPost-demographic dividendPre-demographic dividendQatarRomaniaRussian FederationRwandaSamoaSaudi ArabiaSenegalSerbiaSeychellesSierra LeoneSingaporeSlovak RepublicSloveniaSmall statesSomaliaSouth AfricaSouth AsiaSouth Asia (IDA & IBRD)SpainSri LankaSt. LuciaSub-Saharan Africa Sub-Saharan Africa (excluding high income)Sub-Saharan Africa (IDA & IBRD countries)SudanSurinameSwedenSwitzerlandSyrian Arab RepublicTajikistanTanzaniaThailandTogoTrinidad and TobagoTunisiaTurkeyTurkmenistanUgandaUkraineUnited Arab EmiratesUnited KingdomUnited StatesUpper middle incomeUruguayUzbekistanVenezuela, RBVietnamWorldYemen, Rep.ZambiaZimbabwe Timeline:
This timeline shows a graph from 1961 to 2015 of Kenya. No data until 1960. Number of actual observations by date: 55.
Source name:
World Development Indicators
Source organization:
World Bank staff estimates based data from International Monetary Fund's Direction of Trade database.
Categories, topics:
Private Sector, Trade
Last updated:
apr 23, 2017
Indicators value changes by year
At the date of observation
Value
Absolute change
Change from previous value
jan 1, 1961
0.729
+0.729
0.0%
jan 1, 1962
0.611
-0.118
-16.17%
jan 1, 1963
0.74
+0.128
20.96%
jan 1, 1964
0.858
+0.119
16.07%
jan 1, 1965
1.23
+0.371
43.24%
jan 1, 1966
2.052
+0.823
66.93%
jan 1, 1967
1.396
-0.656
-31.97%
jan 1, 1968
1.633
+0.237
16.99%
jan 1, 1969
1.829
+0.196
11.99%
jan 1, 1970
1.191
-0.638
-34.89%
jan 1, 1971
1.083
-0.108
-9.09%
jan 1, 1972
1.729
+0.647
59.73%
jan 1, 1973
1.574
-0.156
-9.0%
jan 1, 1974
1.373
-0.201
-12.75%
jan 1, 1975
1.705
+0.332
24.16%
jan 1, 1976
2.663
+0.958
56.19%
jan 1, 1977
1.327
-1.337
-50.19%
jan 1, 1978
2.435
+1.108
83.55%
jan 1, 1979
3.061
+0.626
25.73%
jan 1, 1980
2.861
-0.2
-6.54%
jan 1, 1981
2.999
+0.138
4.83%
jan 1, 1982
3.886
+0.887
29.57%
jan 1, 1983
2.796
-1.09
-28.04%
jan 1, 1984
2.196
-0.6
-21.48%
jan 1, 1985
3.015
+0.82
37.34%
jan 1, 1986
3.015
0.0
0.0%
jan 1, 1987
3.015
0.0
0.0%
jan 1, 1988
1.76
-1.255
-41.63%
jan 1, 1989
1.395
-0.365
-20.73%
jan 1, 1990
1.395
0.0
0.0%
jan 1, 1991
3.786
+2.391
171.35%
jan 1, 1992
4.706
+0.92
24.3%
jan 1, 1993
3.769
-0.937
-19.92%
jan 1, 1994
5.111
+1.342
35.61%
jan 1, 1995
3.959
-1.152
-22.55%
jan 1, 1996
4.311
+0.353
8.91%
jan 1, 1997
5.705
+1.394
32.34%
jan 1, 1998
4.423
-1.283
-22.48%
jan 1, 1999
6.807
+2.384
53.9%
jan 1, 2000
4.081
-2.726
-40.05%
jan 1, 2001
6.966
+2.885
70.7%
jan 1, 2002
6.928
-0.038
-0.55%
jan 1, 2003
5.924
-1.003
-14.48%
jan 1, 2004
4.708
-1.216
-20.53%
jan 1, 2005
4.644
-0.064
-1.36%
jan 1, 2006
0.927
-3.718
-80.04%
jan 1, 2007
5.423
+4.496
485.04%
jan 1, 2008
5.447
+0.024
0.44%
jan 1, 2009
5.918
+0.471
8.65%
jan 1, 2010
5.158
-0.76
-12.84%
jan 1, 2011
6.262
+1.104
21.4%
jan 1, 2012
6.393
+0.131
2.1%
jan 1, 2013
5.959
-0.434
-6.78%
jan 1, 2014
5.663
-0.297
-4.98%
jan 1, 2015
5.148
-0.515
-9.09%
Ranking of countries by current statistics by years


Comments: