29
/
en
AIzaSyAYiBZKx7MnpbEhh9jyipgxe19OcubqV5w
April 1, 2024
244747
Somalia
SOM
true
2
1
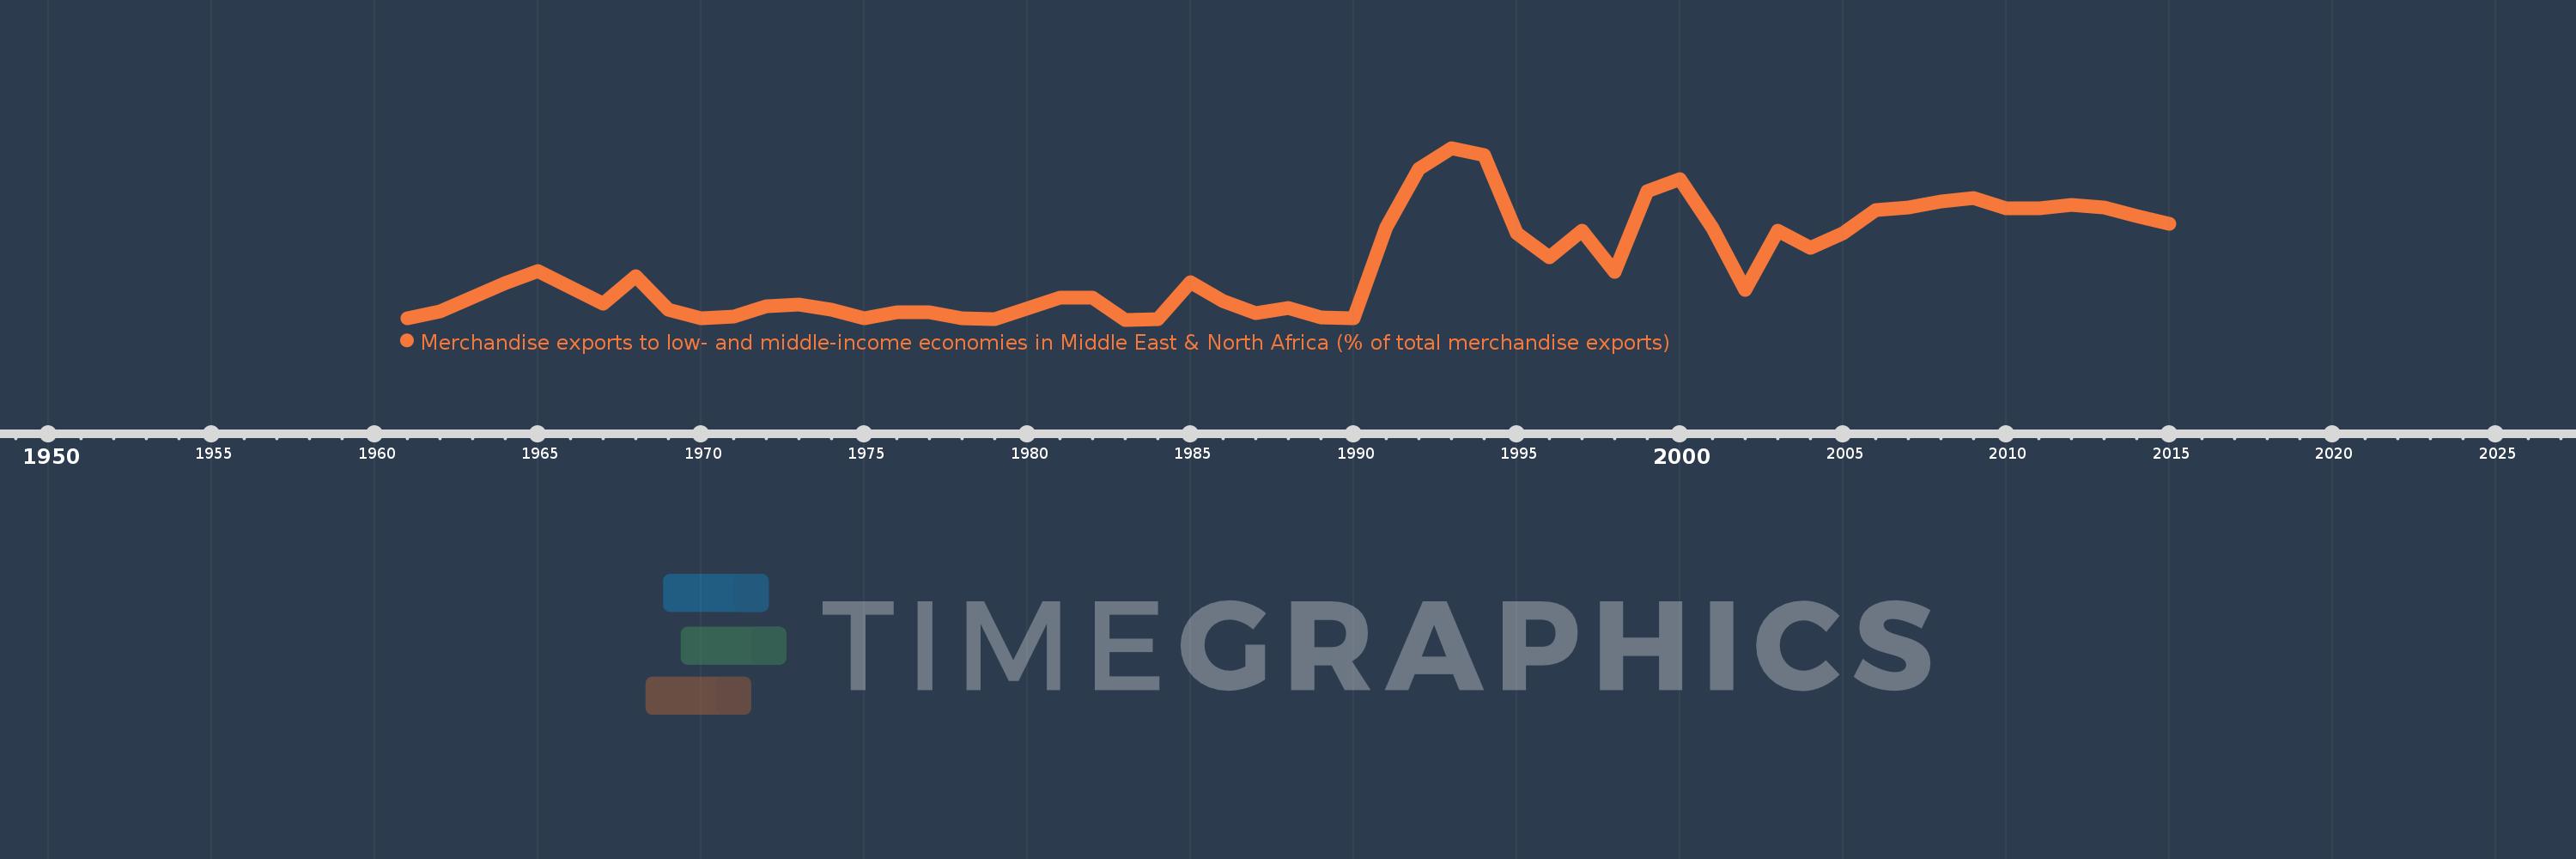
Merchandise exports to low- and middle-income economies in Middle East & North Africa (% of total merchandise exports)
2015,2014,2013,2012,2011,2010,2009,2008,2007,2006,2005,2004,2003,2002,2001,2000,1999,1998,1997,1996,1995,1994,1993,1992,1991,1990,1989,1988,1987,1986,1985,1984,1983,1982,1981,1979,1978,1977,1976,1975,1974,1973,1972,1971,1970,1969,1968,1967,1965,1964,1962,1961
This statistics in other country:
AfghanistanAlbaniaAlgeriaAngolaArab WorldArgentinaArmeniaArubaAustraliaAustriaAzerbaijanBahamas, TheBahrainBangladeshBarbadosBelarusBelgiumBelizeBeninBermudaBoliviaBosnia and HerzegovinaBrazilBrunei DarussalamBulgariaBurkina FasoBurundiCabo VerdeCambodiaCameroonCanadaCaribbean small statesCentral African RepublicCentral Europe and the BalticsChadChileChinaColombiaComorosCongo, Dem. Rep.Congo, Rep.Costa RicaCote d'IvoireCroatiaCubaCyprusCzech RepublicDenmarkDjiboutiDominicaDominican RepublicEarly-demographic dividendEast Asia & PacificEast Asia & Pacific (excluding high income)East Asia & Pacific (IDA & IBRD countries)EcuadorEgypt, Arab Rep.El SalvadorEquatorial GuineaEstoniaEthiopiaEuro areaEurope & Central AsiaEurope & Central Asia (excluding high income)Europe & Central Asia (IDA & IBRD countries)European UnionFijiFinlandFragile and conflict affected situationsFranceGabonGambia, TheGeorgiaGermanyGhanaGreeceGreenlandGrenadaGuatemalaGuineaGuinea-BissauGuyanaHaitiHeavily indebted poor countries (HIPC)High incomeHondurasHong Kong SAR, ChinaHungaryIBRD onlyIcelandIDA & IBRD totalIDA blendIDA onlyIDA totalIndiaIndonesiaIran, Islamic Rep.IraqIrelandIsraelItalyJamaicaJapanJordanKazakhstanKenyaKorea, Dem. People’s Rep.Korea, Rep.KosovoKuwaitKyrgyz RepublicLao PDRLate-demographic dividendLatin America & Caribbean Latin America & Caribbean (excluding high income)Latin America & the Caribbean (IDA & IBRD countries)LatviaLeast developed countries: UN classificationLebanonLiberiaLibyaLithuaniaLow & middle incomeLow incomeLower middle incomeLuxembourgMacao SAR, ChinaMacedonia, FYRMadagascarMalawiMalaysiaMaliMaltaMauritaniaMauritiusMexicoMiddle East & North AfricaMiddle East & North Africa (excluding high income)Middle East & North Africa (IDA & IBRD countries)Middle incomeMoldovaMongoliaMontenegroMoroccoMozambiqueMyanmarNepalNetherlandsNew CaledoniaNew ZealandNicaraguaNigerNigeriaNorth AmericaNorwayOECD membersOmanOther small statesPacific island small statesPakistanPanamaPapua New GuineaParaguayPeruPhilippinesPolandPortugalPost-demographic dividendPre-demographic dividendQatarRomaniaRussian FederationRwandaSamoaSaudi ArabiaSenegalSerbiaSeychellesSierra LeoneSingaporeSlovak RepublicSloveniaSmall statesSomaliaSouth AfricaSouth AsiaSouth Asia (IDA & IBRD)SpainSri LankaSt. LuciaSub-Saharan Africa Sub-Saharan Africa (excluding high income)Sub-Saharan Africa (IDA & IBRD countries)SudanSurinameSwedenSwitzerlandSyrian Arab RepublicTajikistanTanzaniaThailandTogoTrinidad and TobagoTunisiaTurkeyTurkmenistanUgandaUkraineUnited Arab EmiratesUnited KingdomUnited StatesUpper middle incomeUruguayUzbekistanVenezuela, RBVietnamWorldYemen, Rep.ZambiaZimbabwe Timeline:
This timeline shows a graph from 1961 to 2015 of Somalia. No data until 1960. Number of actual observations by date: 52.
Source name:
World Development Indicators
Source organization:
World Bank staff estimates based data from International Monetary Fund's Direction of Trade database.
Categories, topics:
Private Sector, Trade
Last updated:
apr 23, 2017
Indicators value changes by year
Maximum:
35.021
jan 1, 1993
At the date of observation
Value
Absolute change
Change from previous value
jan 1, 1961
0.435
+0.435
0.0%
jan 1, 1962
1.901
+1.466
337.26%
jan 1, 1964
7.5
+5.599
294.5%
jan 1, 1965
10.028
+2.528
33.7%
jan 1, 1967
3.343
-6.684
-66.66%
jan 1, 1968
8.901
+5.557
166.21%
jan 1, 1969
2.123
-6.778
-76.15%
jan 1, 1970
0.345
-1.778
-83.75%
jan 1, 1971
0.683
+0.338
97.92%
jan 1, 1972
2.843
+2.161
316.47%
jan 1, 1973
3.285
+0.441
15.52%
jan 1, 1974
2.148
-1.137
-34.6%
jan 1, 1975
0.466
-1.682
-78.31%
jan 1, 1976
1.716
+1.25
268.36%
jan 1, 1977
1.565
-0.151
-8.83%
jan 1, 1978
0.44
-1.124
-71.87%
jan 1, 1979
0.277
-0.163
-37.1%
jan 1, 1981
4.646
+4.369
1.58K%
jan 1, 1982
4.646
+0.0
0.0%
jan 1, 1983
0.122
-4.524
-97.38%
jan 1, 1984
0.165
+0.043
35.43%
jan 1, 1985
7.702
+7.537
4.56K%
jan 1, 1986
3.858
-3.845
-49.91%
jan 1, 1987
1.435
-2.422
-62.79%
jan 1, 1988
2.511
+1.076
74.94%
jan 1, 1989
0.597
-1.914
-76.21%
jan 1, 1990
0.413
-0.185
-30.9%
jan 1, 1991
18.901
+18.488
4.48K%
jan 1, 1992
30.694
+11.793
62.39%
jan 1, 1993
35.021
+4.327
14.1%
jan 1, 1994
33.528
-1.492
-4.26%
jan 1, 1995
17.662
-15.866
-47.32%
jan 1, 1996
12.853
-4.809
-27.23%
jan 1, 1997
18.168
+5.315
41.35%
jan 1, 1998
9.857
-8.311
-45.74%
jan 1, 1999
26.187
+16.33
165.66%
jan 1, 2000
28.769
+2.583
9.86%
jan 1, 2001
18.687
-10.083
-35.05%
jan 1, 2002
6.216
-12.471
-66.74%
jan 1, 2003
18.3
+12.085
194.43%
jan 1, 2004
14.793
-3.507
-19.17%
jan 1, 2005
17.654
+2.862
19.34%
jan 1, 2006
22.416
+4.762
26.97%
jan 1, 2007
22.924
+0.508
2.27%
jan 1, 2008
24.215
+1.291
5.63%
jan 1, 2009
24.858
+0.643
2.66%
jan 1, 2010
22.808
-2.051
-8.25%
jan 1, 2011
22.795
-0.012
-0.05%
jan 1, 2012
23.515
+0.72
3.16%
jan 1, 2013
22.89
-0.625
-2.66%
jan 1, 2014
21.235
-1.655
-7.23%
jan 1, 2015
19.581
-1.654
-7.79%
Ranking of countries by current statistics by years


Comments: