29
/
en
AIzaSyAYiBZKx7MnpbEhh9jyipgxe19OcubqV5w
April 1, 2024
70098
Argentina
ARG
true
2
1
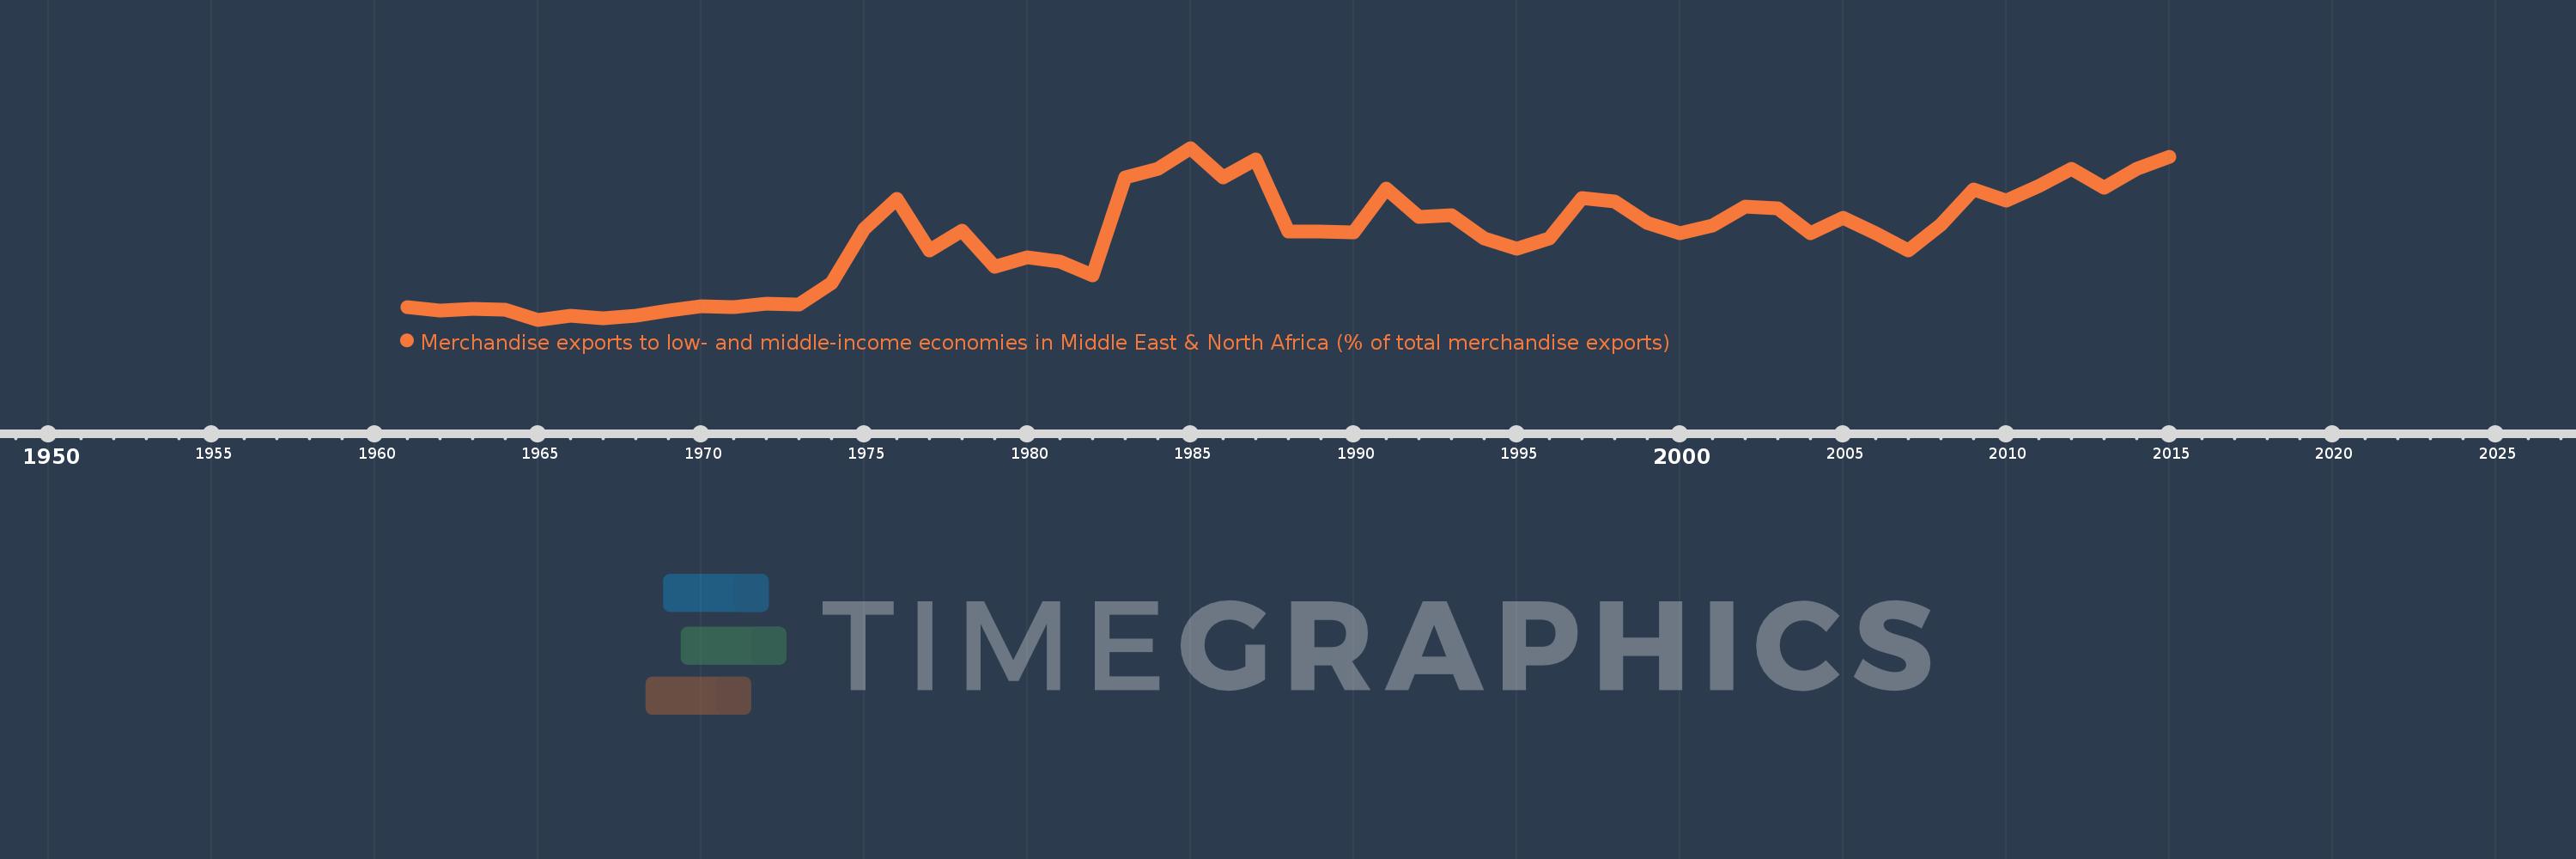
Merchandise exports to low- and middle-income economies in Middle East & North Africa (% of total merchandise exports)
2015,2014,2013,2012,2011,2010,2009,2008,2007,2006,2005,2004,2003,2002,2001,2000,1999,1998,1997,1996,1995,1994,1993,1992,1991,1990,1989,1988,1987,1986,1985,1984,1983,1982,1981,1980,1979,1978,1977,1976,1975,1974,1973,1972,1971,1970,1969,1968,1967,1966,1965,1964,1963,1962,1961
This statistics in other country:
AfghanistanAlbaniaAlgeriaAngolaArab WorldArgentinaArmeniaArubaAustraliaAustriaAzerbaijanBahamas, TheBahrainBangladeshBarbadosBelarusBelgiumBelizeBeninBermudaBoliviaBosnia and HerzegovinaBrazilBrunei DarussalamBulgariaBurkina FasoBurundiCabo VerdeCambodiaCameroonCanadaCaribbean small statesCentral African RepublicCentral Europe and the BalticsChadChileChinaColombiaComorosCongo, Dem. Rep.Congo, Rep.Costa RicaCote d'IvoireCroatiaCubaCyprusCzech RepublicDenmarkDjiboutiDominicaDominican RepublicEarly-demographic dividendEast Asia & PacificEast Asia & Pacific (excluding high income)East Asia & Pacific (IDA & IBRD countries)EcuadorEgypt, Arab Rep.El SalvadorEquatorial GuineaEstoniaEthiopiaEuro areaEurope & Central AsiaEurope & Central Asia (excluding high income)Europe & Central Asia (IDA & IBRD countries)European UnionFijiFinlandFragile and conflict affected situationsFranceGabonGambia, TheGeorgiaGermanyGhanaGreeceGreenlandGrenadaGuatemalaGuineaGuinea-BissauGuyanaHaitiHeavily indebted poor countries (HIPC)High incomeHondurasHong Kong SAR, ChinaHungaryIBRD onlyIcelandIDA & IBRD totalIDA blendIDA onlyIDA totalIndiaIndonesiaIran, Islamic Rep.IraqIrelandIsraelItalyJamaicaJapanJordanKazakhstanKenyaKorea, Dem. People’s Rep.Korea, Rep.KosovoKuwaitKyrgyz RepublicLao PDRLate-demographic dividendLatin America & Caribbean Latin America & Caribbean (excluding high income)Latin America & the Caribbean (IDA & IBRD countries)LatviaLeast developed countries: UN classificationLebanonLiberiaLibyaLithuaniaLow & middle incomeLow incomeLower middle incomeLuxembourgMacao SAR, ChinaMacedonia, FYRMadagascarMalawiMalaysiaMaliMaltaMauritaniaMauritiusMexicoMiddle East & North AfricaMiddle East & North Africa (excluding high income)Middle East & North Africa (IDA & IBRD countries)Middle incomeMoldovaMongoliaMontenegroMoroccoMozambiqueMyanmarNepalNetherlandsNew CaledoniaNew ZealandNicaraguaNigerNigeriaNorth AmericaNorwayOECD membersOmanOther small statesPacific island small statesPakistanPanamaPapua New GuineaParaguayPeruPhilippinesPolandPortugalPost-demographic dividendPre-demographic dividendQatarRomaniaRussian FederationRwandaSamoaSaudi ArabiaSenegalSerbiaSeychellesSierra LeoneSingaporeSlovak RepublicSloveniaSmall statesSomaliaSouth AfricaSouth AsiaSouth Asia (IDA & IBRD)SpainSri LankaSt. LuciaSub-Saharan Africa Sub-Saharan Africa (excluding high income)Sub-Saharan Africa (IDA & IBRD countries)SudanSurinameSwedenSwitzerlandSyrian Arab RepublicTajikistanTanzaniaThailandTogoTrinidad and TobagoTunisiaTurkeyTurkmenistanUgandaUkraineUnited Arab EmiratesUnited KingdomUnited StatesUpper middle incomeUruguayUzbekistanVenezuela, RBVietnamWorldYemen, Rep.ZambiaZimbabwe Timeline:
This timeline shows a graph from 1961 to 2015 of Argentina. No data until 1960. Number of actual observations by date: 55.
Source name:
World Development Indicators
Source organization:
World Bank staff estimates based data from International Monetary Fund's Direction of Trade database.
Categories, topics:
Private Sector, Trade
Last updated:
apr 23, 2017
Indicators value changes by year
At the date of observation
Value
Absolute change
Change from previous value
jan 1, 1961
0.732
+0.732
0.0%
jan 1, 1962
0.539
-0.193
-26.33%
jan 1, 1963
0.633
+0.094
17.34%
jan 1, 1964
0.608
-0.024
-3.87%
jan 1, 1965
0.114
-0.495
-81.34%
jan 1, 1966
0.302
+0.188
165.64%
jan 1, 1967
0.176
-0.126
-41.72%
jan 1, 1968
0.328
+0.152
86.46%
jan 1, 1969
0.549
+0.221
67.56%
jan 1, 1970
0.75
+0.201
36.62%
jan 1, 1971
0.712
-0.038
-5.12%
jan 1, 1972
0.899
+0.187
26.33%
jan 1, 1973
0.838
-0.061
-6.84%
jan 1, 1974
1.906
+1.068
127.52%
jan 1, 1975
4.492
+2.586
135.65%
jan 1, 1976
5.937
+1.446
32.19%
jan 1, 1977
3.471
-2.467
-41.55%
jan 1, 1978
4.401
+0.931
26.82%
jan 1, 1979
2.683
-1.718
-39.04%
jan 1, 1980
3.133
+0.45
16.79%
jan 1, 1981
2.92
-0.213
-6.81%
jan 1, 1982
2.247
-0.673
-23.05%
jan 1, 1983
6.977
+4.73
210.49%
jan 1, 1984
7.427
+0.451
6.46%
jan 1, 1985
8.419
+0.992
13.35%
jan 1, 1986
6.98
-1.439
-17.09%
jan 1, 1987
7.873
+0.893
12.79%
jan 1, 1988
4.384
-3.489
-44.32%
jan 1, 1989
4.378
-0.006
-0.14%
jan 1, 1990
4.323
-0.054
-1.24%
jan 1, 1991
6.475
+2.152
49.77%
jan 1, 1992
5.101
-1.374
-21.22%
jan 1, 1993
5.149
+0.048
0.95%
jan 1, 1994
4.053
-1.096
-21.29%
jan 1, 1995
3.559
-0.494
-12.2%
jan 1, 1996
4.067
+0.508
14.28%
jan 1, 1997
5.988
+1.921
47.23%
jan 1, 1998
5.836
-0.152
-2.53%
jan 1, 1999
4.782
-1.054
-18.06%
jan 1, 2000
4.292
-0.491
-10.26%
jan 1, 2001
4.668
+0.377
8.77%
jan 1, 2002
5.565
+0.897
19.21%
jan 1, 2003
5.483
-0.082
-1.47%
jan 1, 2004
4.308
-1.175
-21.43%
jan 1, 2005
5.032
+0.724
16.8%
jan 1, 2006
4.282
-0.749
-14.89%
jan 1, 2007
3.485
-0.797
-18.62%
jan 1, 2008
4.715
+1.23
35.3%
jan 1, 2009
6.407
+1.691
35.87%
jan 1, 2010
5.86
-0.547
-8.54%
jan 1, 2011
6.569
+0.71
12.11%
jan 1, 2012
7.415
+0.845
12.87%
jan 1, 2013
6.492
-0.923
-12.45%
jan 1, 2014
7.413
+0.921
14.18%
jan 1, 2015
7.996
+0.584
7.87%
Ranking of countries by current statistics by years


Comments: