29
/
en
AIzaSyAYiBZKx7MnpbEhh9jyipgxe19OcubqV5w
April 1, 2024
98867
Cambodia
KHM
true
2
1
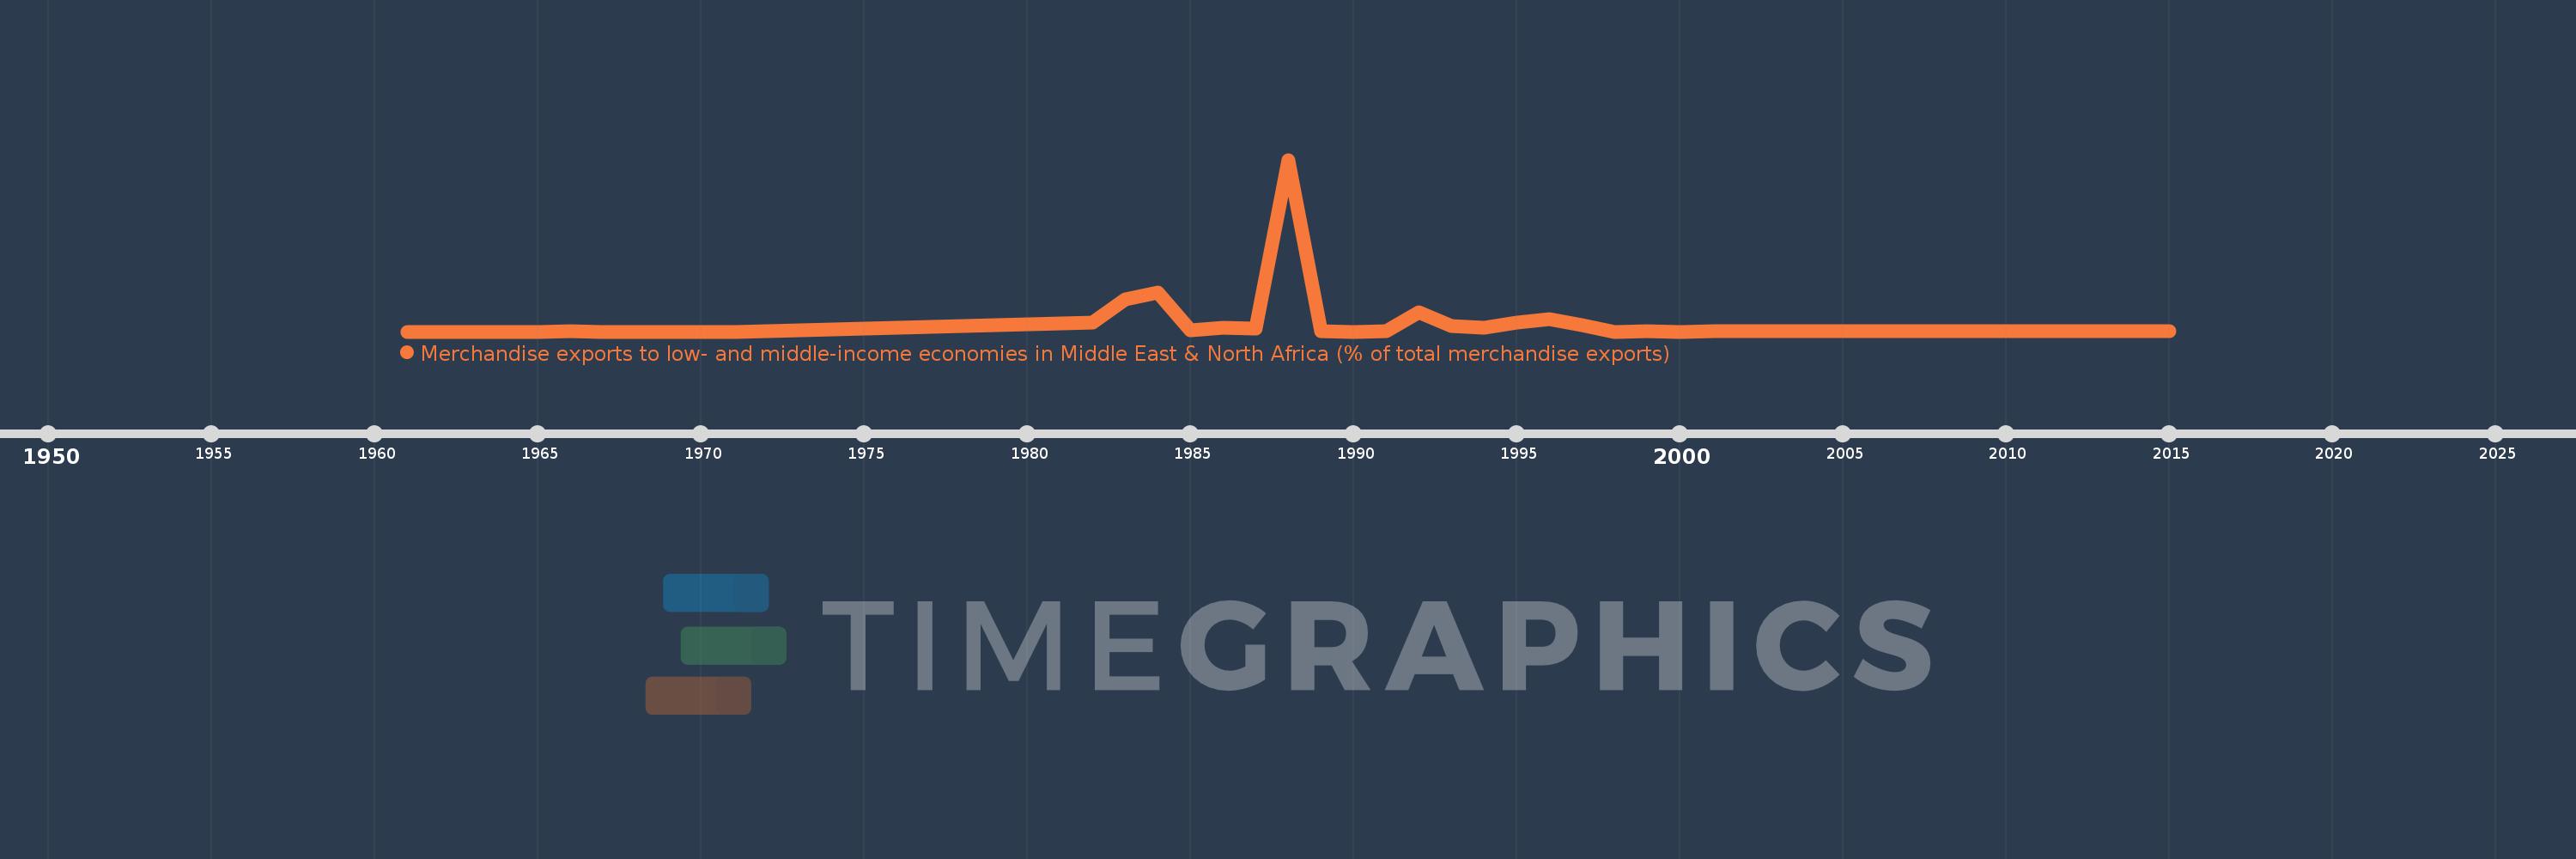
Merchandise exports to low- and middle-income economies in Middle East & North Africa (% of total merchandise exports)
2015,2014,2013,2012,2011,2010,2009,2008,2007,2006,2005,2004,2003,2002,2001,2000,1999,1998,1997,1996,1995,1994,1993,1992,1991,1990,1989,1988,1987,1986,1985,1984,1983,1982,1971,1969,1968,1967,1966,1965,1964,1963,1962,1961
This statistics in other country:
AfghanistanAlbaniaAlgeriaAngolaArab WorldArgentinaArmeniaArubaAustraliaAustriaAzerbaijanBahamas, TheBahrainBangladeshBarbadosBelarusBelgiumBelizeBeninBermudaBoliviaBosnia and HerzegovinaBrazilBrunei DarussalamBulgariaBurkina FasoBurundiCabo VerdeCambodiaCameroonCanadaCaribbean small statesCentral African RepublicCentral Europe and the BalticsChadChileChinaColombiaComorosCongo, Dem. Rep.Congo, Rep.Costa RicaCote d'IvoireCroatiaCubaCyprusCzech RepublicDenmarkDjiboutiDominicaDominican RepublicEarly-demographic dividendEast Asia & PacificEast Asia & Pacific (excluding high income)East Asia & Pacific (IDA & IBRD countries)EcuadorEgypt, Arab Rep.El SalvadorEquatorial GuineaEstoniaEthiopiaEuro areaEurope & Central AsiaEurope & Central Asia (excluding high income)Europe & Central Asia (IDA & IBRD countries)European UnionFijiFinlandFragile and conflict affected situationsFranceGabonGambia, TheGeorgiaGermanyGhanaGreeceGreenlandGrenadaGuatemalaGuineaGuinea-BissauGuyanaHaitiHeavily indebted poor countries (HIPC)High incomeHondurasHong Kong SAR, ChinaHungaryIBRD onlyIcelandIDA & IBRD totalIDA blendIDA onlyIDA totalIndiaIndonesiaIran, Islamic Rep.IraqIrelandIsraelItalyJamaicaJapanJordanKazakhstanKenyaKorea, Dem. People’s Rep.Korea, Rep.KosovoKuwaitKyrgyz RepublicLao PDRLate-demographic dividendLatin America & Caribbean Latin America & Caribbean (excluding high income)Latin America & the Caribbean (IDA & IBRD countries)LatviaLeast developed countries: UN classificationLebanonLiberiaLibyaLithuaniaLow & middle incomeLow incomeLower middle incomeLuxembourgMacao SAR, ChinaMacedonia, FYRMadagascarMalawiMalaysiaMaliMaltaMauritaniaMauritiusMexicoMiddle East & North AfricaMiddle East & North Africa (excluding high income)Middle East & North Africa (IDA & IBRD countries)Middle incomeMoldovaMongoliaMontenegroMoroccoMozambiqueMyanmarNepalNetherlandsNew CaledoniaNew ZealandNicaraguaNigerNigeriaNorth AmericaNorwayOECD membersOmanOther small statesPacific island small statesPakistanPanamaPapua New GuineaParaguayPeruPhilippinesPolandPortugalPost-demographic dividendPre-demographic dividendQatarRomaniaRussian FederationRwandaSamoaSaudi ArabiaSenegalSerbiaSeychellesSierra LeoneSingaporeSlovak RepublicSloveniaSmall statesSomaliaSouth AfricaSouth AsiaSouth Asia (IDA & IBRD)SpainSri LankaSt. LuciaSub-Saharan Africa Sub-Saharan Africa (excluding high income)Sub-Saharan Africa (IDA & IBRD countries)SudanSurinameSwedenSwitzerlandSyrian Arab RepublicTajikistanTanzaniaThailandTogoTrinidad and TobagoTunisiaTurkeyTurkmenistanUgandaUkraineUnited Arab EmiratesUnited KingdomUnited StatesUpper middle incomeUruguayUzbekistanVenezuela, RBVietnamWorldYemen, Rep.ZambiaZimbabwe Timeline:
This timeline shows a graph from 1961 to 2015 of Cambodia. No data until 1960. Number of actual observations by date: 44.
Source name:
World Development Indicators
Source organization:
World Bank staff estimates based data from International Monetary Fund's Direction of Trade database.
Categories, topics:
Private Sector, Trade
Last updated:
apr 23, 2017
Indicators value changes by year
Maximum:
45.388
jan 1, 1988
At the date of observation
Value
Absolute change
Change from previous value
jan 1, 1966
0.115
+0.115
%
jan 1, 1967
0.0
-0.115
-100.0%
jan 1, 1982
2.299
+2.299
%
jan 1, 1983
8.545
+6.247
271.73%
jan 1, 1984
10.347
+1.801
21.08%
jan 1, 1985
0.229
-10.117
-97.78%
jan 1, 1986
1.133
+0.903
393.63%
jan 1, 1987
0.735
-0.398
-35.14%
jan 1, 1988
45.388
+44.653
6.08K%
jan 1, 1989
0.217
-45.171
-99.52%
jan 1, 1990
0.0
-0.217
-100.0%
jan 1, 1991
0.107
+0.107
%
jan 1, 1992
5.081
+4.975
4.66K%
jan 1, 1993
1.464
-3.617
-71.18%
jan 1, 1994
0.99
-0.474
-32.39%
jan 1, 1995
2.392
+1.402
141.61%
jan 1, 1996
3.353
+0.961
40.19%
jan 1, 1997
1.73
-1.623
-48.41%
jan 1, 1998
0.0
-1.73
-100.0%
jan 1, 1999
0.003
+0.003
%
jan 1, 2000
0.0
-0.003
-100.0%
jan 1, 2001
0.003
+0.003
%
jan 1, 2002
0.002
-0.001
-40.82%
jan 1, 2003
0.009
+0.007
450.8%
jan 1, 2004
0.032
+0.023
269.74%
jan 1, 2005
0.01
-0.022
-69.67%
jan 1, 2006
0.004
-0.006
-60.37%
jan 1, 2007
0.009
+0.006
146.17%
jan 1, 2008
0.006
-0.003
-32.22%
jan 1, 2009
0.031
+0.025
391.98%
jan 1, 2010
0.058
+0.027
87.8%
jan 1, 2011
0.136
+0.077
132.52%
jan 1, 2012
0.037
-0.099
-72.57%
jan 1, 2013
0.045
+0.008
21.72%
jan 1, 2014
0.025
-0.02
-45.08%
jan 1, 2015
0.204
+0.179
716.5%
Ranking of countries by current statistics by years


Comments: