29
/
en
AIzaSyAYiBZKx7MnpbEhh9jyipgxe19OcubqV5w
April 1, 2024
225112
Poland
POL
true
2
1
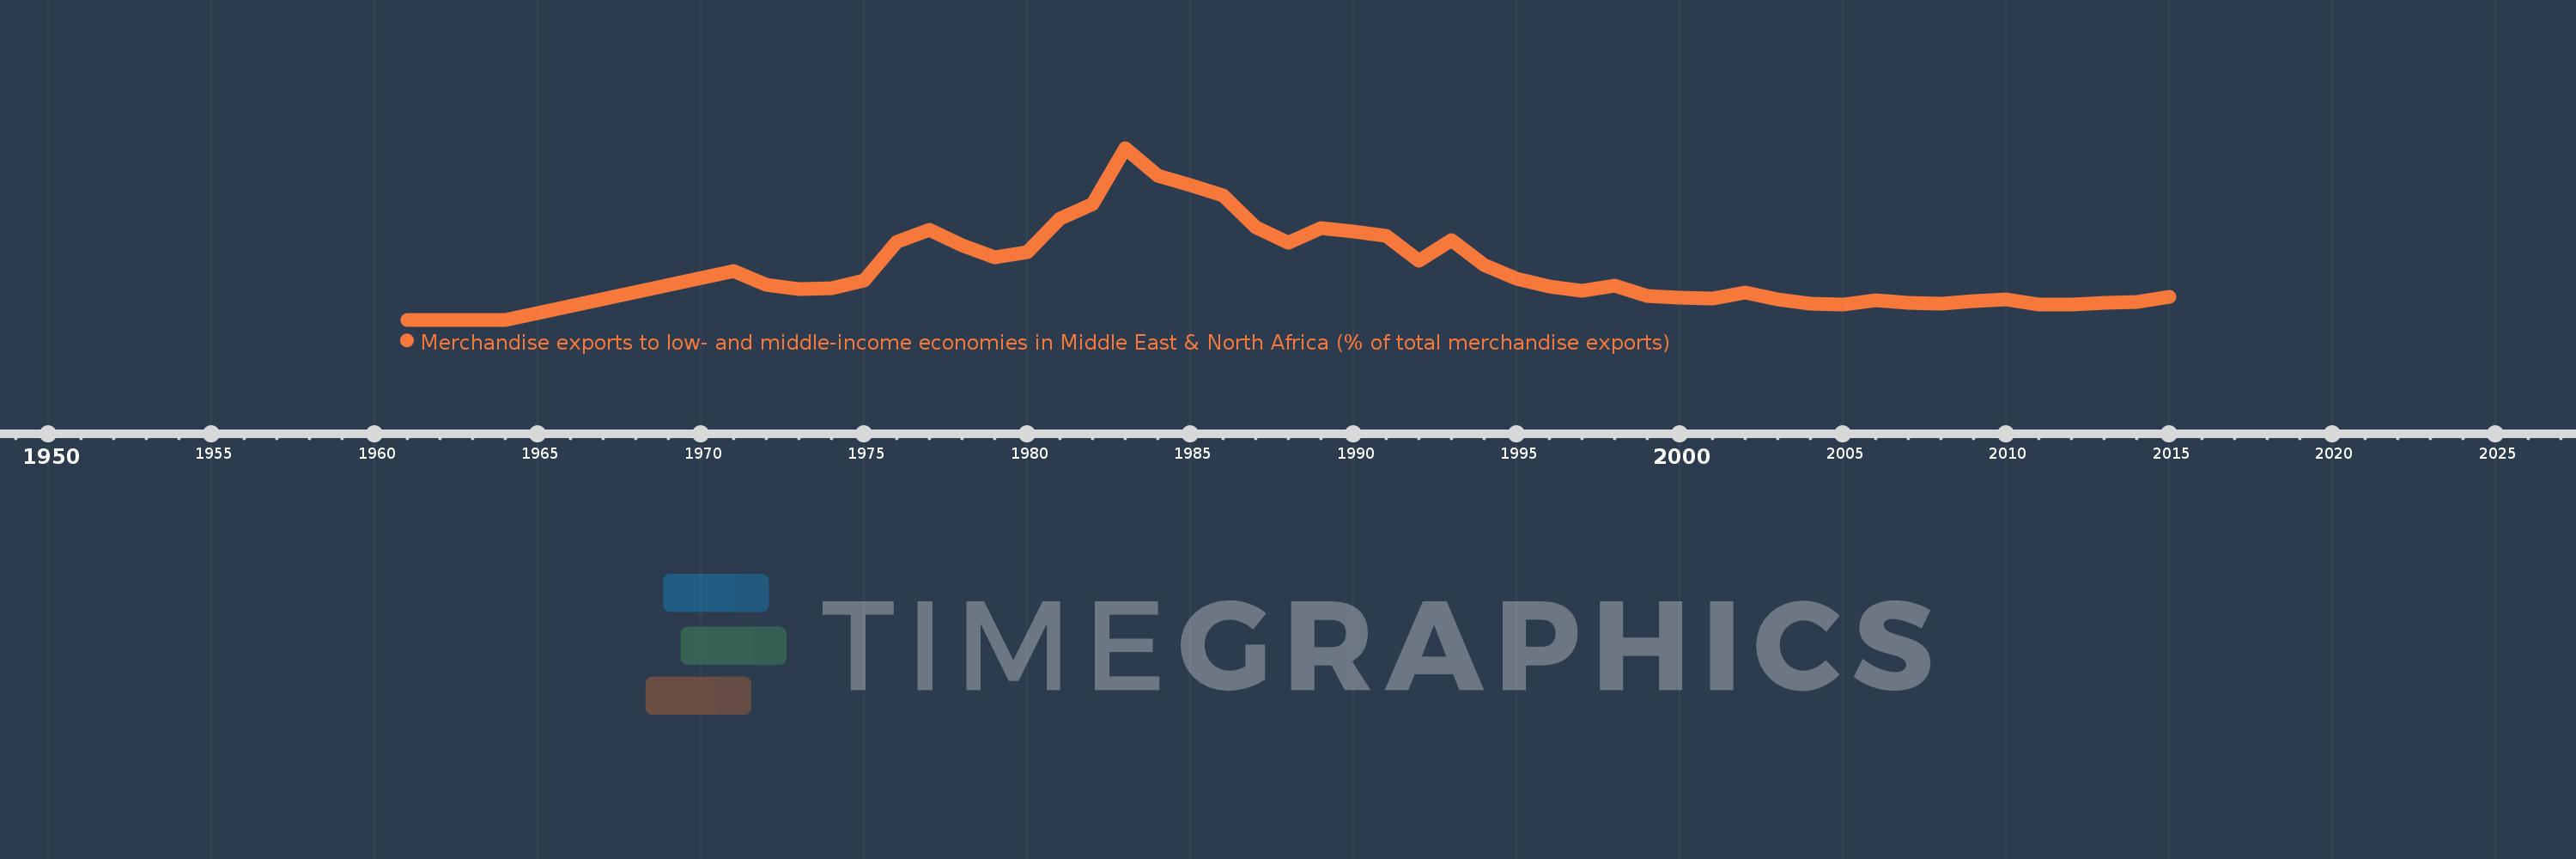
Merchandise exports to low- and middle-income economies in Middle East & North Africa (% of total merchandise exports)
2015,2014,2013,2012,2011,2010,2009,2008,2007,2006,2005,2004,2003,2002,2001,2000,1999,1998,1997,1996,1995,1994,1993,1992,1991,1990,1989,1988,1987,1986,1985,1984,1983,1982,1981,1980,1979,1978,1977,1976,1975,1974,1973,1972,1971,1964,1963,1962,1961
This statistics in other country:
AfghanistanAlbaniaAlgeriaAngolaArab WorldArgentinaArmeniaArubaAustraliaAustriaAzerbaijanBahamas, TheBahrainBangladeshBarbadosBelarusBelgiumBelizeBeninBermudaBoliviaBosnia and HerzegovinaBrazilBrunei DarussalamBulgariaBurkina FasoBurundiCabo VerdeCambodiaCameroonCanadaCaribbean small statesCentral African RepublicCentral Europe and the BalticsChadChileChinaColombiaComorosCongo, Dem. Rep.Congo, Rep.Costa RicaCote d'IvoireCroatiaCubaCyprusCzech RepublicDenmarkDjiboutiDominicaDominican RepublicEarly-demographic dividendEast Asia & PacificEast Asia & Pacific (excluding high income)East Asia & Pacific (IDA & IBRD countries)EcuadorEgypt, Arab Rep.El SalvadorEquatorial GuineaEstoniaEthiopiaEuro areaEurope & Central AsiaEurope & Central Asia (excluding high income)Europe & Central Asia (IDA & IBRD countries)European UnionFijiFinlandFragile and conflict affected situationsFranceGabonGambia, TheGeorgiaGermanyGhanaGreeceGreenlandGrenadaGuatemalaGuineaGuinea-BissauGuyanaHaitiHeavily indebted poor countries (HIPC)High incomeHondurasHong Kong SAR, ChinaHungaryIBRD onlyIcelandIDA & IBRD totalIDA blendIDA onlyIDA totalIndiaIndonesiaIran, Islamic Rep.IraqIrelandIsraelItalyJamaicaJapanJordanKazakhstanKenyaKorea, Dem. People’s Rep.Korea, Rep.KosovoKuwaitKyrgyz RepublicLao PDRLate-demographic dividendLatin America & Caribbean Latin America & Caribbean (excluding high income)Latin America & the Caribbean (IDA & IBRD countries)LatviaLeast developed countries: UN classificationLebanonLiberiaLibyaLithuaniaLow & middle incomeLow incomeLower middle incomeLuxembourgMacao SAR, ChinaMacedonia, FYRMadagascarMalawiMalaysiaMaliMaltaMauritaniaMauritiusMexicoMiddle East & North AfricaMiddle East & North Africa (excluding high income)Middle East & North Africa (IDA & IBRD countries)Middle incomeMoldovaMongoliaMontenegroMoroccoMozambiqueMyanmarNepalNetherlandsNew CaledoniaNew ZealandNicaraguaNigerNigeriaNorth AmericaNorwayOECD membersOmanOther small statesPacific island small statesPakistanPanamaPapua New GuineaParaguayPeruPhilippinesPolandPortugalPost-demographic dividendPre-demographic dividendQatarRomaniaRussian FederationRwandaSamoaSaudi ArabiaSenegalSerbiaSeychellesSierra LeoneSingaporeSlovak RepublicSloveniaSmall statesSomaliaSouth AfricaSouth AsiaSouth Asia (IDA & IBRD)SpainSri LankaSt. LuciaSub-Saharan Africa Sub-Saharan Africa (excluding high income)Sub-Saharan Africa (IDA & IBRD countries)SudanSurinameSwedenSwitzerlandSyrian Arab RepublicTajikistanTanzaniaThailandTogoTrinidad and TobagoTunisiaTurkeyTurkmenistanUgandaUkraineUnited Arab EmiratesUnited KingdomUnited StatesUpper middle incomeUruguayUzbekistanVenezuela, RBVietnamWorldYemen, Rep.ZambiaZimbabwe Timeline:
This timeline shows a graph from 1961 to 2015 of Poland. No data until 1960. Number of actual observations by date: 49.
Source name:
World Development Indicators
Source organization:
World Bank staff estimates based data from International Monetary Fund's Direction of Trade database.
Categories, topics:
Private Sector, Trade
Last updated:
apr 23, 2017
Indicators value changes by year
At the date of observation
Value
Absolute change
Change from previous value
jan 1, 1971
1.911
+1.911
%
jan 1, 1972
1.346
-0.565
-29.57%
jan 1, 1973
1.207
-0.139
-10.3%
jan 1, 1974
1.21
+0.003
0.24%
jan 1, 1975
1.543
+0.334
27.57%
jan 1, 1976
3.034
+1.491
96.58%
jan 1, 1977
3.501
+0.467
15.4%
jan 1, 1978
2.891
-0.61
-17.42%
jan 1, 1979
2.416
-0.476
-16.45%
jan 1, 1980
2.637
+0.221
9.16%
jan 1, 1981
3.948
+1.311
49.71%
jan 1, 1982
4.488
+0.54
13.69%
jan 1, 1983
6.685
+2.197
48.96%
jan 1, 1984
5.607
-1.078
-16.12%
jan 1, 1985
5.253
-0.355
-6.33%
jan 1, 1986
4.849
-0.404
-7.68%
jan 1, 1987
3.615
-1.234
-25.44%
jan 1, 1988
2.998
-0.617
-17.07%
jan 1, 1989
3.583
+0.585
19.51%
jan 1, 1990
3.445
-0.138
-3.84%
jan 1, 1991
3.265
-0.18
-5.23%
jan 1, 1992
2.297
-0.968
-29.64%
jan 1, 1993
3.102
+0.804
35.02%
jan 1, 1994
2.115
-0.987
-31.81%
jan 1, 1995
1.605
-0.51
-24.12%
jan 1, 1996
1.297
-0.308
-19.17%
jan 1, 1997
1.139
-0.158
-12.2%
jan 1, 1998
1.331
+0.192
16.87%
jan 1, 1999
0.942
-0.389
-29.23%
jan 1, 2000
0.872
-0.07
-7.42%
jan 1, 2001
0.819
-0.053
-6.1%
jan 1, 2002
1.063
+0.245
29.85%
jan 1, 2003
0.776
-0.287
-27.0%
jan 1, 2004
0.637
-0.139
-17.95%
jan 1, 2005
0.575
-0.062
-9.8%
jan 1, 2006
0.775
+0.2
34.85%
jan 1, 2007
0.675
-0.1
-12.92%
jan 1, 2008
0.619
-0.055
-8.21%
jan 1, 2009
0.729
+0.11
17.73%
jan 1, 2010
0.802
+0.073
9.99%
jan 1, 2011
0.607
-0.195
-24.35%
jan 1, 2012
0.592
-0.014
-2.37%
jan 1, 2013
0.644
+0.052
8.76%
jan 1, 2014
0.691
+0.047
7.26%
jan 1, 2015
0.879
+0.188
27.2%
Ranking of countries by current statistics by years


Comments: