29
/
en
AIzaSyAYiBZKx7MnpbEhh9jyipgxe19OcubqV5w
April 1, 2024
77358
Bahrain
BHR
true
2
1
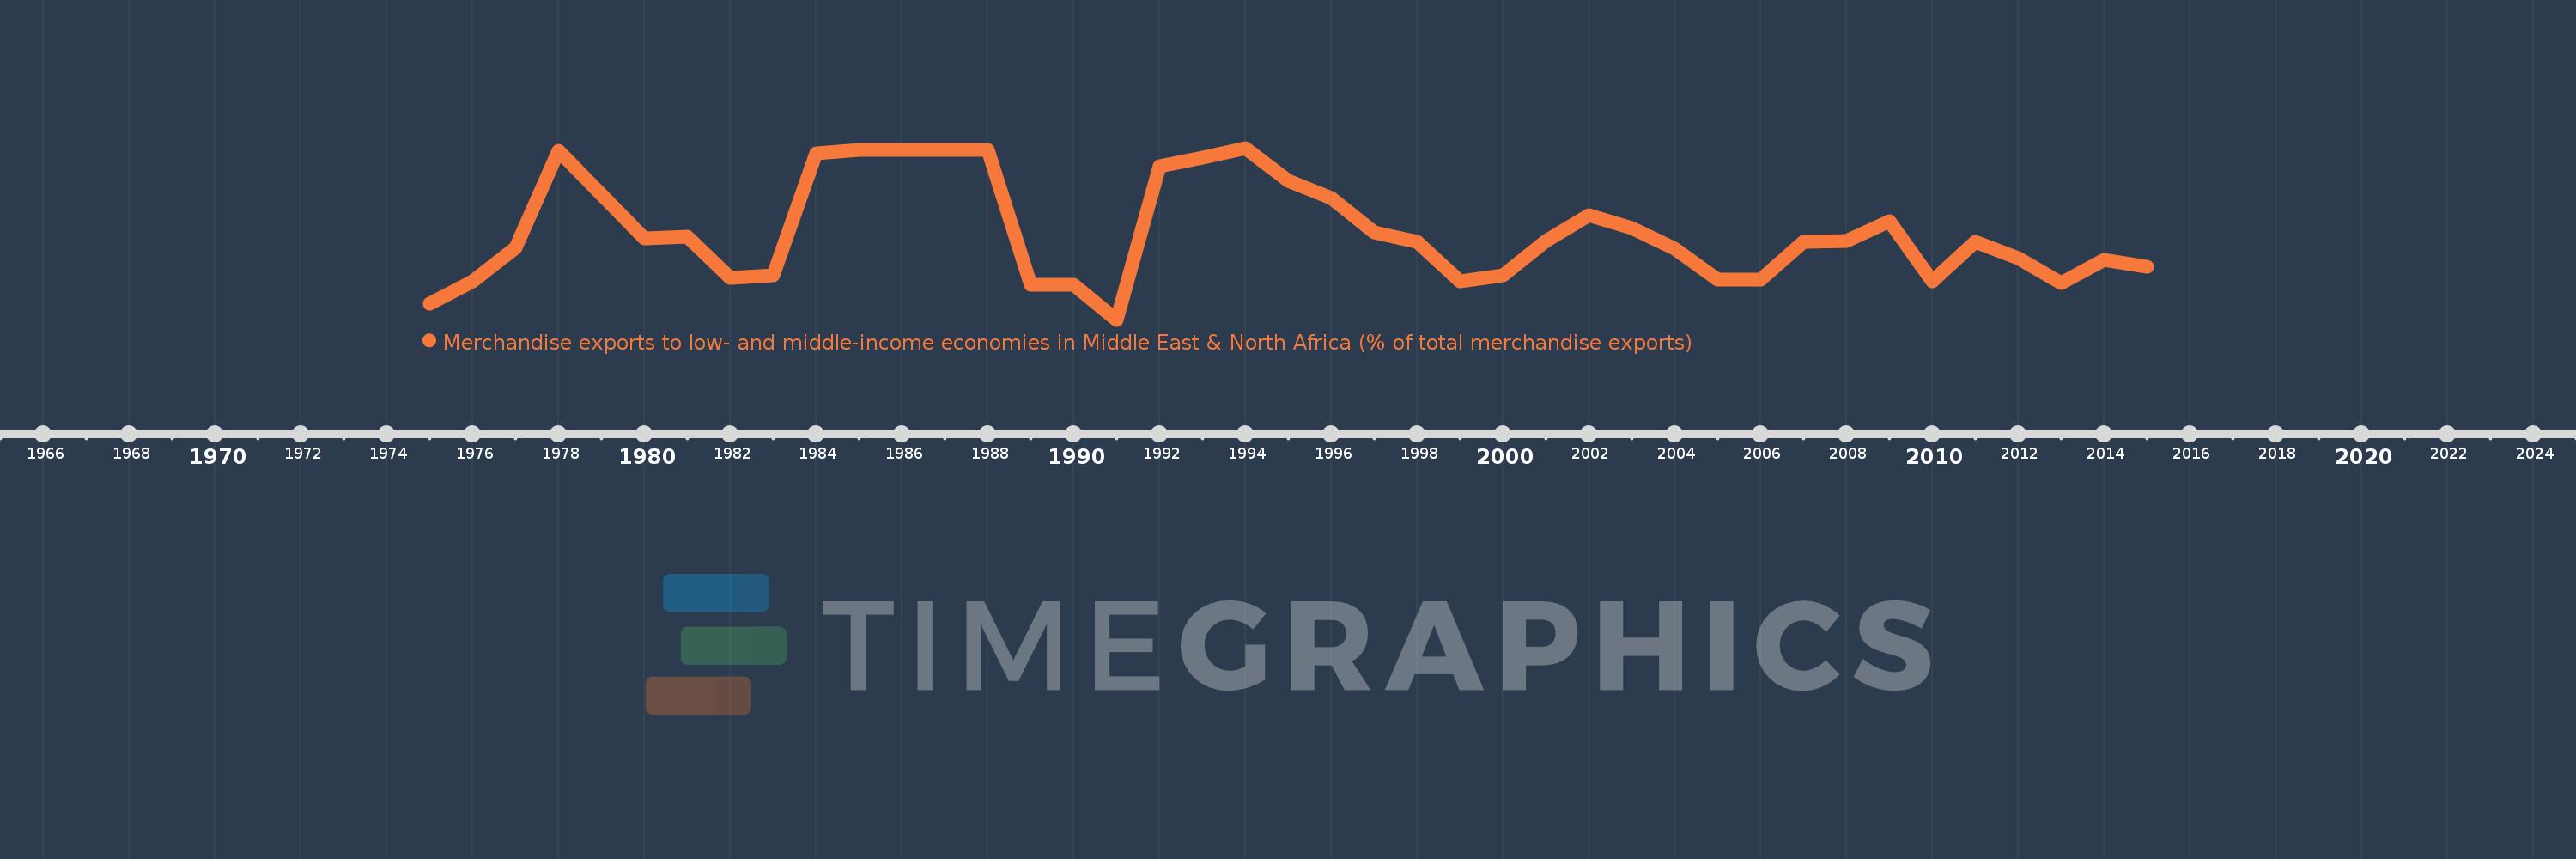
Merchandise exports to low- and middle-income economies in Middle East & North Africa (% of total merchandise exports)
2015,2014,2013,2012,2011,2010,2009,2008,2007,2006,2005,2004,2003,2002,2001,2000,1999,1998,1997,1996,1995,1994,1993,1992,1991,1990,1989,1988,1987,1986,1985,1984,1983,1982,1981,1980,1978,1977,1976,1975
This statistics in other country:
AfghanistanAlbaniaAlgeriaAngolaArab WorldArgentinaArmeniaArubaAustraliaAustriaAzerbaijanBahamas, TheBahrainBangladeshBarbadosBelarusBelgiumBelizeBeninBermudaBoliviaBosnia and HerzegovinaBrazilBrunei DarussalamBulgariaBurkina FasoBurundiCabo VerdeCambodiaCameroonCanadaCaribbean small statesCentral African RepublicCentral Europe and the BalticsChadChileChinaColombiaComorosCongo, Dem. Rep.Congo, Rep.Costa RicaCote d'IvoireCroatiaCubaCyprusCzech RepublicDenmarkDjiboutiDominicaDominican RepublicEarly-demographic dividendEast Asia & PacificEast Asia & Pacific (excluding high income)East Asia & Pacific (IDA & IBRD countries)EcuadorEgypt, Arab Rep.El SalvadorEquatorial GuineaEstoniaEthiopiaEuro areaEurope & Central AsiaEurope & Central Asia (excluding high income)Europe & Central Asia (IDA & IBRD countries)European UnionFijiFinlandFragile and conflict affected situationsFranceGabonGambia, TheGeorgiaGermanyGhanaGreeceGreenlandGrenadaGuatemalaGuineaGuinea-BissauGuyanaHaitiHeavily indebted poor countries (HIPC)High incomeHondurasHong Kong SAR, ChinaHungaryIBRD onlyIcelandIDA & IBRD totalIDA blendIDA onlyIDA totalIndiaIndonesiaIran, Islamic Rep.IraqIrelandIsraelItalyJamaicaJapanJordanKazakhstanKenyaKorea, Dem. People’s Rep.Korea, Rep.KosovoKuwaitKyrgyz RepublicLao PDRLate-demographic dividendLatin America & Caribbean Latin America & Caribbean (excluding high income)Latin America & the Caribbean (IDA & IBRD countries)LatviaLeast developed countries: UN classificationLebanonLiberiaLibyaLithuaniaLow & middle incomeLow incomeLower middle incomeLuxembourgMacao SAR, ChinaMacedonia, FYRMadagascarMalawiMalaysiaMaliMaltaMauritaniaMauritiusMexicoMiddle East & North AfricaMiddle East & North Africa (excluding high income)Middle East & North Africa (IDA & IBRD countries)Middle incomeMoldovaMongoliaMontenegroMoroccoMozambiqueMyanmarNepalNetherlandsNew CaledoniaNew ZealandNicaraguaNigerNigeriaNorth AmericaNorwayOECD membersOmanOther small statesPacific island small statesPakistanPanamaPapua New GuineaParaguayPeruPhilippinesPolandPortugalPost-demographic dividendPre-demographic dividendQatarRomaniaRussian FederationRwandaSamoaSaudi ArabiaSenegalSerbiaSeychellesSierra LeoneSingaporeSlovak RepublicSloveniaSmall statesSomaliaSouth AfricaSouth AsiaSouth Asia (IDA & IBRD)SpainSri LankaSt. LuciaSub-Saharan Africa Sub-Saharan Africa (excluding high income)Sub-Saharan Africa (IDA & IBRD countries)SudanSurinameSwedenSwitzerlandSyrian Arab RepublicTajikistanTanzaniaThailandTogoTrinidad and TobagoTunisiaTurkeyTurkmenistanUgandaUkraineUnited Arab EmiratesUnited KingdomUnited StatesUpper middle incomeUruguayUzbekistanVenezuela, RBVietnamWorldYemen, Rep.ZambiaZimbabwe Timeline:
This timeline shows a graph from 1975 to 2015 of Bahrain. No data until 1974. Number of actual observations by date: 40.
Source name:
World Development Indicators
Source organization:
World Bank staff estimates based data from International Monetary Fund's Direction of Trade database.
Categories, topics:
Private Sector, Trade
Last updated:
apr 23, 2017
Indicators value changes by year
At the date of observation
Value
Absolute change
Change from previous value
jan 1, 1975
0.519
+0.519
0.0%
jan 1, 1976
0.917
+0.398
76.69%
jan 1, 1977
1.513
+0.596
65.04%
jan 1, 1978
3.219
+1.706
112.69%
jan 1, 1980
1.68
-1.539
-47.81%
jan 1, 1981
1.702
+0.022
1.33%
jan 1, 1982
0.984
-0.719
-42.23%
jan 1, 1983
1.03
+0.047
4.74%
jan 1, 1984
3.177
+2.147
208.44%
jan 1, 1985
3.236
+0.059
1.84%
jan 1, 1986
3.236
0.0
0.0%
jan 1, 1987
3.236
+0.0
0.0%
jan 1, 1988
3.236
+0.0
0.0%
jan 1, 1989
0.854
-2.382
-73.6%
jan 1, 1990
0.854
+0.0
0.0%
jan 1, 1991
0.242
-0.612
-71.61%
jan 1, 1992
2.946
+2.704
1.11K%
jan 1, 1993
3.102
+0.156
5.31%
jan 1, 1994
3.27
+0.168
5.41%
jan 1, 1995
2.696
-0.574
-17.55%
jan 1, 1996
2.388
-0.308
-11.43%
jan 1, 1997
1.778
-0.61
-25.53%
jan 1, 1998
1.608
-0.17
-9.55%
jan 1, 1999
0.917
-0.691
-42.96%
jan 1, 2000
1.028
+0.11
12.0%
jan 1, 2001
1.632
+0.604
58.81%
jan 1, 2002
2.082
+0.45
27.57%
jan 1, 2003
1.862
-0.22
-10.56%
jan 1, 2004
1.491
-0.371
-19.94%
jan 1, 2005
0.955
-0.536
-35.95%
jan 1, 2006
0.952
-0.003
-0.31%
jan 1, 2007
1.613
+0.661
69.46%
jan 1, 2008
1.636
+0.023
1.41%
jan 1, 2009
1.983
+0.347
21.25%
jan 1, 2010
0.926
-1.057
-53.32%
jan 1, 2011
1.62
+0.694
74.95%
jan 1, 2012
1.331
-0.289
-17.82%
jan 1, 2013
0.881
-0.45
-33.83%
jan 1, 2014
1.303
+0.422
47.94%
jan 1, 2015
1.175
-0.128
-9.79%
Ranking of countries by current statistics by years


Comments: