29
/
en
AIzaSyAYiBZKx7MnpbEhh9jyipgxe19OcubqV5w
April 1, 2024
48310
Middle East & North Africa
MEA
false
2
1
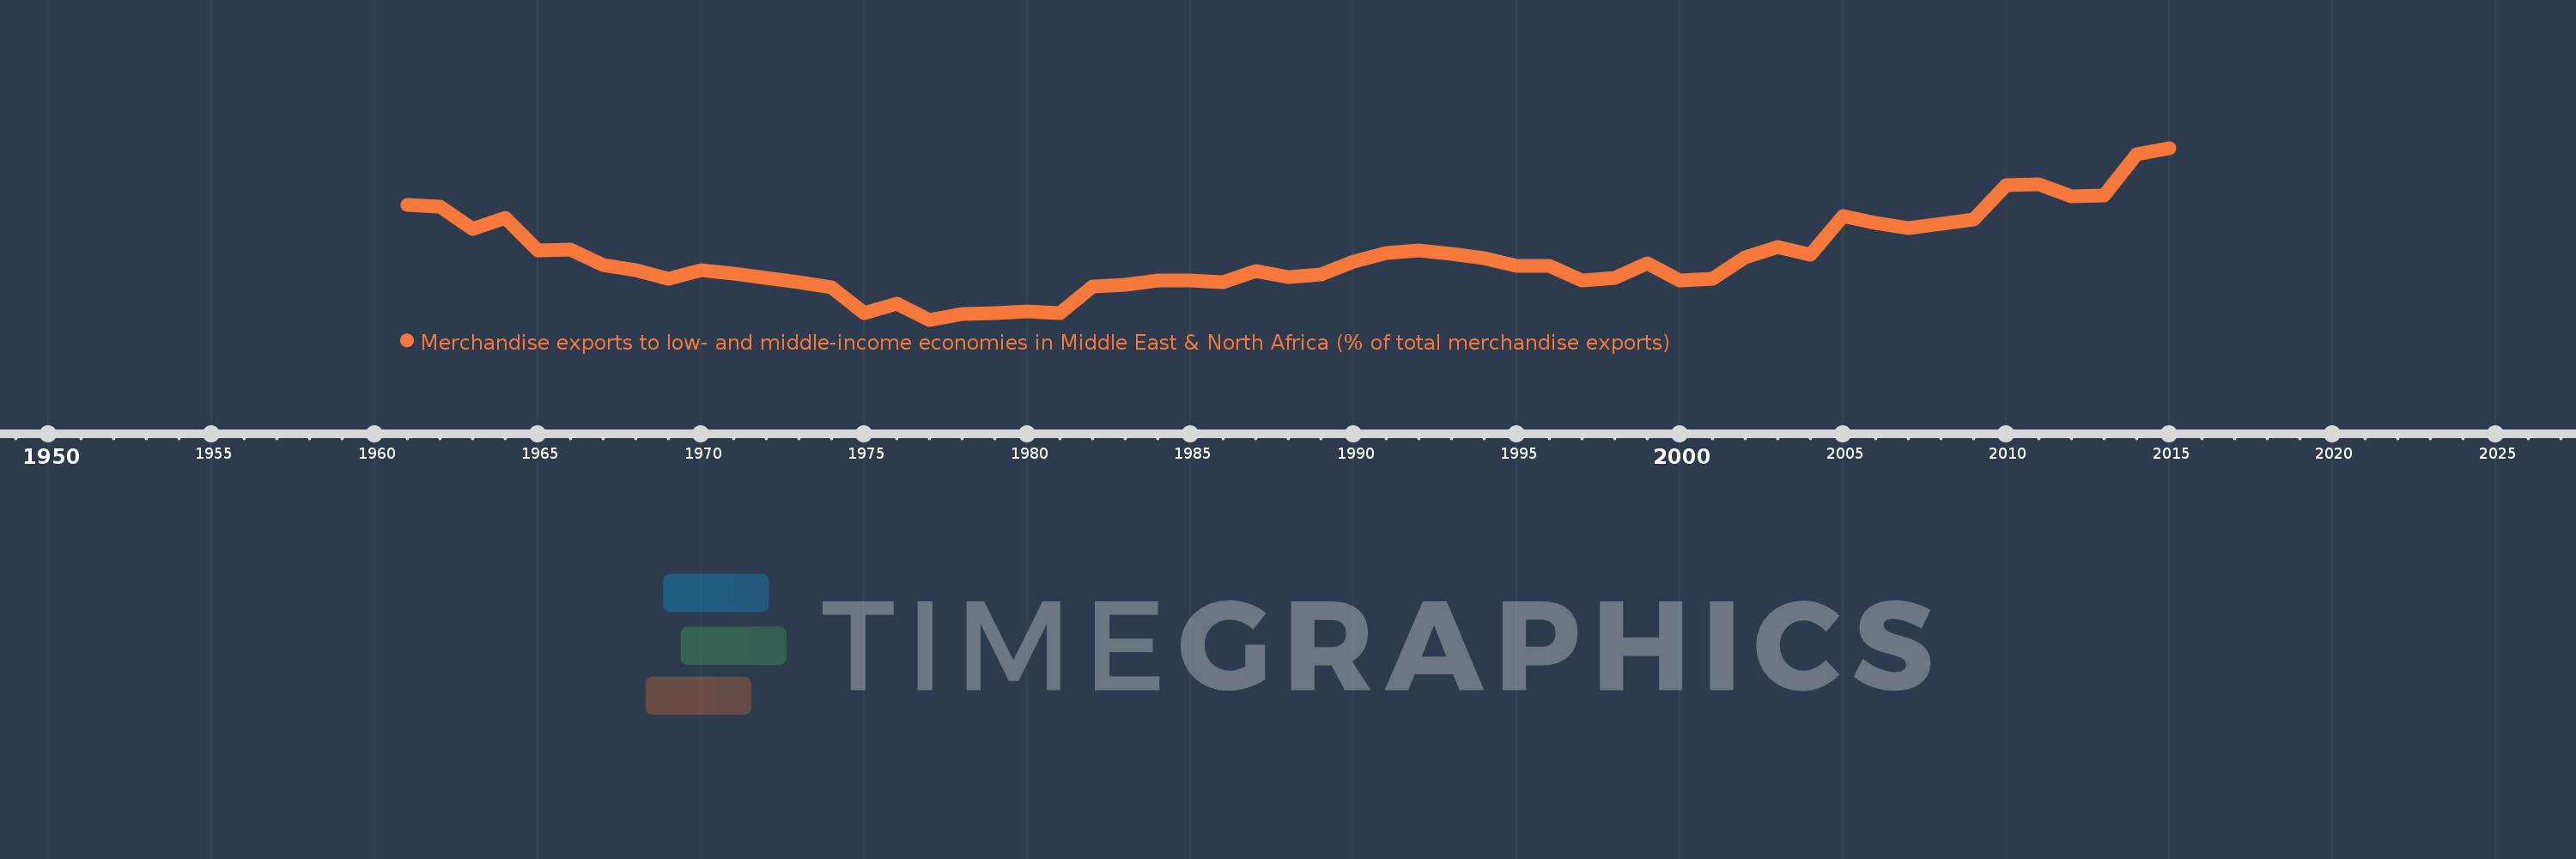
Merchandise exports to low- and middle-income economies in Middle East & North Africa (% of total merchandise exports)
2015,2014,2013,2012,2011,2010,2009,2008,2007,2006,2005,2004,2003,2002,2001,2000,1999,1998,1997,1996,1995,1994,1993,1992,1991,1990,1989,1988,1987,1986,1985,1984,1983,1982,1981,1980,1979,1978,1977,1976,1975,1974,1973,1972,1971,1970,1969,1968,1967,1966,1965,1964,1963,1962,1961
This statistics in other country:
AfghanistanAlbaniaAlgeriaAngolaArab WorldArgentinaArmeniaArubaAustraliaAustriaAzerbaijanBahamas, TheBahrainBangladeshBarbadosBelarusBelgiumBelizeBeninBermudaBoliviaBosnia and HerzegovinaBrazilBrunei DarussalamBulgariaBurkina FasoBurundiCabo VerdeCambodiaCameroonCanadaCaribbean small statesCentral African RepublicCentral Europe and the BalticsChadChileChinaColombiaComorosCongo, Dem. Rep.Congo, Rep.Costa RicaCote d'IvoireCroatiaCubaCyprusCzech RepublicDenmarkDjiboutiDominicaDominican RepublicEarly-demographic dividendEast Asia & PacificEast Asia & Pacific (excluding high income)East Asia & Pacific (IDA & IBRD countries)EcuadorEgypt, Arab Rep.El SalvadorEquatorial GuineaEstoniaEthiopiaEuro areaEurope & Central AsiaEurope & Central Asia (excluding high income)Europe & Central Asia (IDA & IBRD countries)European UnionFijiFinlandFragile and conflict affected situationsFranceGabonGambia, TheGeorgiaGermanyGhanaGreeceGreenlandGrenadaGuatemalaGuineaGuinea-BissauGuyanaHaitiHeavily indebted poor countries (HIPC)High incomeHondurasHong Kong SAR, ChinaHungaryIBRD onlyIcelandIDA & IBRD totalIDA blendIDA onlyIDA totalIndiaIndonesiaIran, Islamic Rep.IraqIrelandIsraelItalyJamaicaJapanJordanKazakhstanKenyaKorea, Dem. People’s Rep.Korea, Rep.KosovoKuwaitKyrgyz RepublicLao PDRLate-demographic dividendLatin America & Caribbean Latin America & Caribbean (excluding high income)Latin America & the Caribbean (IDA & IBRD countries)LatviaLeast developed countries: UN classificationLebanonLiberiaLibyaLithuaniaLow & middle incomeLow incomeLower middle incomeLuxembourgMacao SAR, ChinaMacedonia, FYRMadagascarMalawiMalaysiaMaliMaltaMauritaniaMauritiusMexicoMiddle East & North AfricaMiddle East & North Africa (excluding high income)Middle East & North Africa (IDA & IBRD countries)Middle incomeMoldovaMongoliaMontenegroMoroccoMozambiqueMyanmarNepalNetherlandsNew CaledoniaNew ZealandNicaraguaNigerNigeriaNorth AmericaNorwayOECD membersOmanOther small statesPacific island small statesPakistanPanamaPapua New GuineaParaguayPeruPhilippinesPolandPortugalPost-demographic dividendPre-demographic dividendQatarRomaniaRussian FederationRwandaSamoaSaudi ArabiaSenegalSerbiaSeychellesSierra LeoneSingaporeSlovak RepublicSloveniaSmall statesSomaliaSouth AfricaSouth AsiaSouth Asia (IDA & IBRD)SpainSri LankaSt. LuciaSub-Saharan Africa Sub-Saharan Africa (excluding high income)Sub-Saharan Africa (IDA & IBRD countries)SudanSurinameSwedenSwitzerlandSyrian Arab RepublicTajikistanTanzaniaThailandTogoTrinidad and TobagoTunisiaTurkeyTurkmenistanUgandaUkraineUnited Arab EmiratesUnited KingdomUnited StatesUpper middle incomeUruguayUzbekistanVenezuela, RBVietnamWorldYemen, Rep.ZambiaZimbabwe Timeline:
This timeline shows a graph from 1961 to 2015 of Middle East & North Africa. No data until 1960. Number of actual observations by date: 55.
Source name:
World Development Indicators
Source organization:
World Bank staff estimates based data from International Monetary Fund's Direction of Trade database.
Categories, topics:
Private Sector, Trade
Last updated:
apr 23, 2017
Indicators value changes by year
At the date of observation
Value
Absolute change
Change from previous value
jan 1, 1961
5.817
+5.817
0.0%
jan 1, 1962
5.757
-0.061
-1.04%
jan 1, 1963
4.873
-0.883
-15.35%
jan 1, 1964
5.319
+0.445
9.14%
jan 1, 1965
4.026
-1.292
-24.3%
jan 1, 1966
4.058
+0.031
0.78%
jan 1, 1967
3.429
-0.629
-15.5%
jan 1, 1968
3.226
-0.203
-5.93%
jan 1, 1969
2.899
-0.327
-10.13%
jan 1, 1970
3.25
+0.351
12.12%
jan 1, 1971
3.111
-0.139
-4.27%
jan 1, 1972
2.937
-0.174
-5.6%
jan 1, 1973
2.78
-0.157
-5.34%
jan 1, 1974
2.562
-0.218
-7.86%
jan 1, 1975
1.541
-1.021
-39.85%
jan 1, 1976
1.936
+0.395
25.65%
jan 1, 1977
1.287
-0.649
-33.54%
jan 1, 1978
1.512
+0.225
17.49%
jan 1, 1979
1.551
+0.04
2.62%
jan 1, 1980
1.605
+0.054
3.47%
jan 1, 1981
1.547
-0.058
-3.64%
jan 1, 1982
2.611
+1.064
68.78%
jan 1, 1983
2.648
+0.037
1.42%
jan 1, 1984
2.832
+0.184
6.94%
jan 1, 1985
2.825
-0.006
-0.22%
jan 1, 1986
2.769
-0.056
-1.99%
jan 1, 1987
3.208
+0.438
15.83%
jan 1, 1988
2.955
-0.252
-7.86%
jan 1, 1989
3.078
+0.123
4.15%
jan 1, 1990
3.594
+0.516
16.75%
jan 1, 1991
3.913
+0.32
8.89%
jan 1, 1992
4.028
+0.115
2.94%
jan 1, 1993
3.895
-0.133
-3.29%
jan 1, 1994
3.718
-0.178
-4.57%
jan 1, 1995
3.413
-0.304
-8.19%
jan 1, 1996
3.392
-0.021
-0.63%
jan 1, 1997
2.845
-0.547
-16.12%
jan 1, 1998
2.919
+0.074
2.61%
jan 1, 1999
3.497
+0.578
19.79%
jan 1, 2000
2.826
-0.671
-19.19%
jan 1, 2001
2.906
+0.08
2.82%
jan 1, 2002
3.74
+0.834
28.71%
jan 1, 2003
4.137
+0.397
10.63%
jan 1, 2004
3.856
-0.281
-6.8%
jan 1, 2005
5.358
+1.501
38.94%
jan 1, 2006
5.107
-0.251
-4.68%
jan 1, 2007
4.91
-0.197
-3.85%
jan 1, 2008
5.077
+0.167
3.41%
jan 1, 2009
5.222
+0.145
2.85%
jan 1, 2010
6.573
+1.351
25.86%
jan 1, 2011
6.634
+0.061
0.94%
jan 1, 2012
6.137
-0.497
-7.49%
jan 1, 2013
6.169
+0.032
0.53%
jan 1, 2014
7.813
+1.644
26.65%
jan 1, 2015
8.055
+0.242
3.1%
Ranking of countries by current statistics by years


Comments: