29
/
en
AIzaSyAYiBZKx7MnpbEhh9jyipgxe19OcubqV5w
April 1, 2024
69841
Argentina
ARG
true
2
1
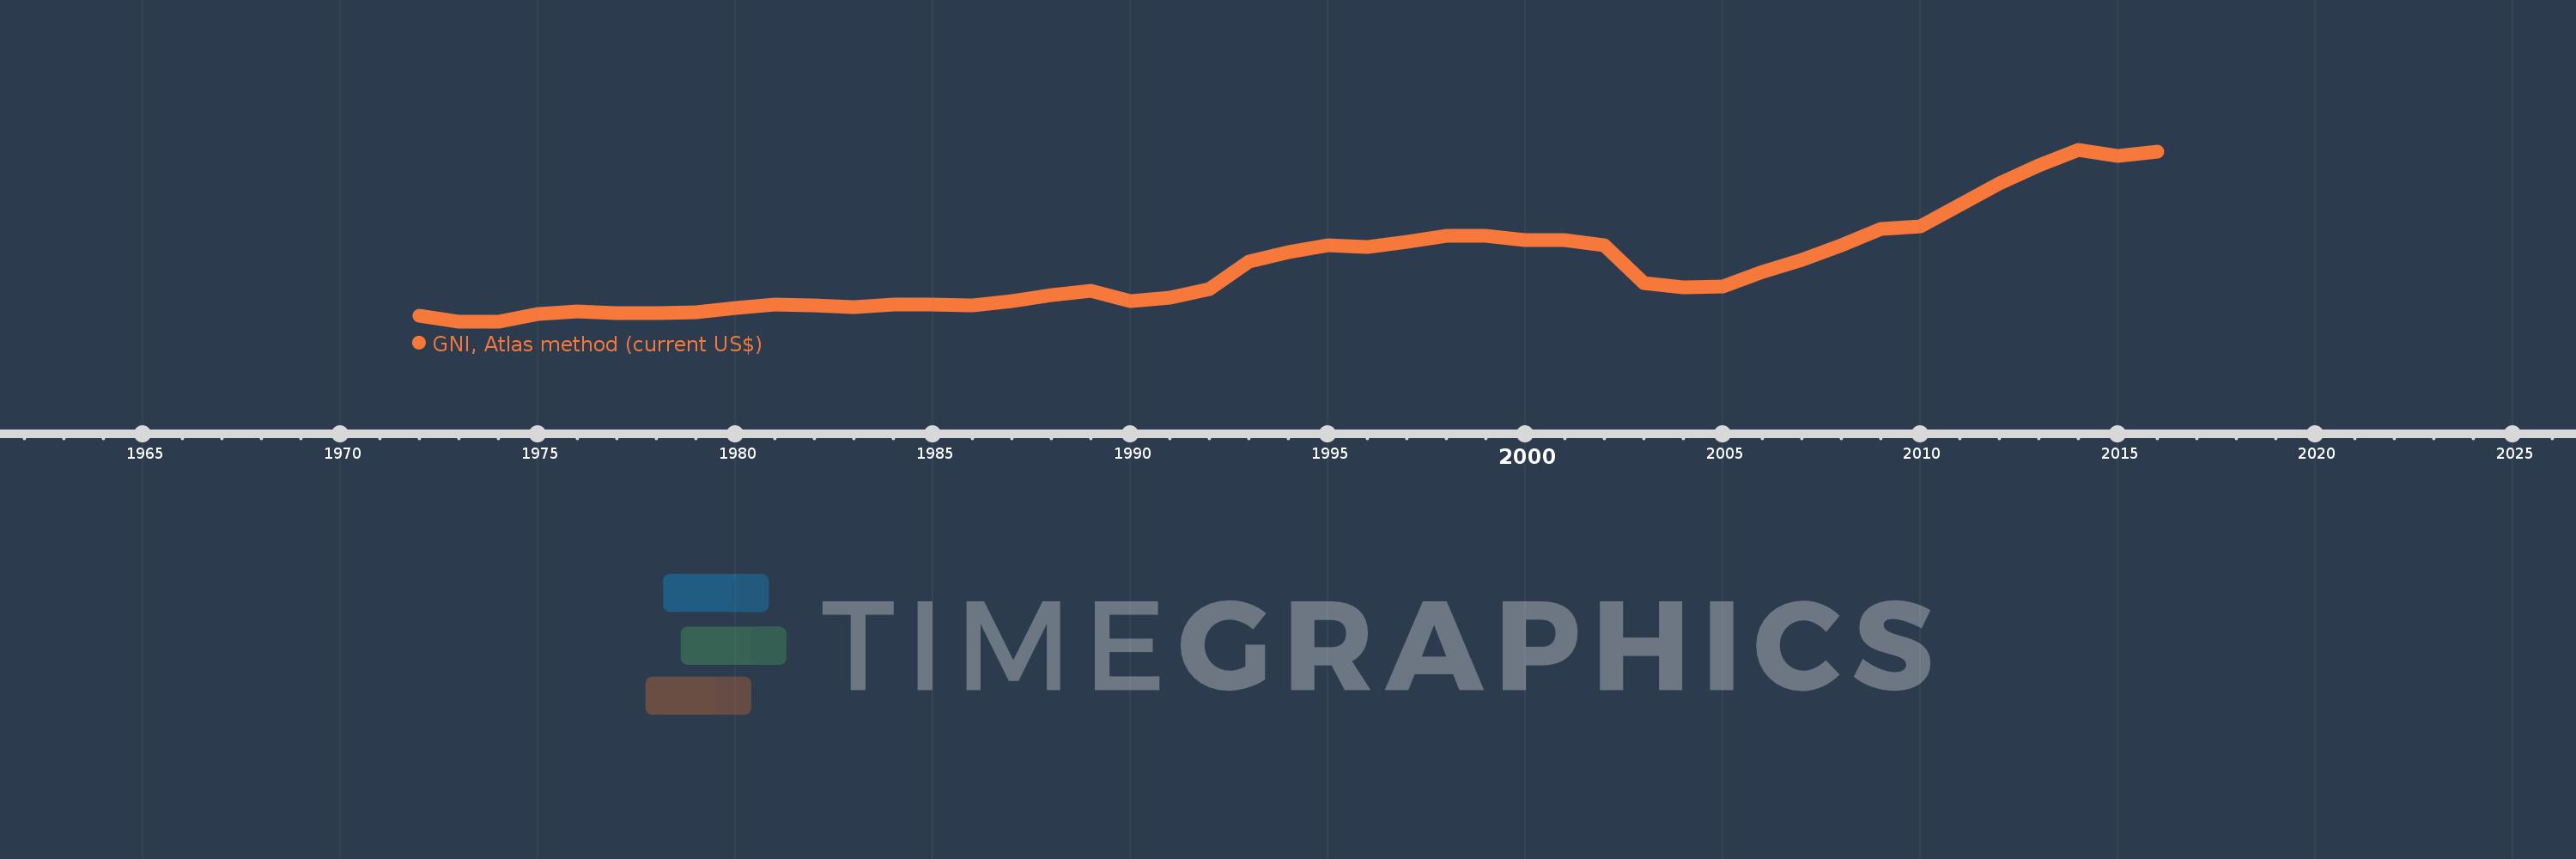
GNI, Atlas method (current US$)
2016,2015,2014,2013,2012,2011,2010,2009,2008,2007,2006,2005,2004,2003,2002,2001,2000,1999,1998,1997,1996,1995,1994,1993,1992,1991,1990,1989,1988,1987,1986,1985,1984,1983,1982,1981,1980,1979,1978,1977,1976,1975,1974,1973,1972
This statistics in other country:
AfghanistanAlbaniaAlgeriaAndorraAngolaAntigua and BarbudaArab WorldArgentinaArmeniaAustraliaAustriaAzerbaijanBahamas, TheBahrainBangladeshBarbadosBelarusBelgiumBelizeBeninBermudaBhutanBoliviaBosnia and HerzegovinaBotswanaBrazilBrunei DarussalamBulgariaBurkina FasoBurundiCabo VerdeCambodiaCameroonCanadaCaribbean small statesCentral African RepublicCentral Europe and the BalticsChadChannel IslandsChileChinaColombiaComorosCongo, Dem. Rep.Congo, Rep.Costa RicaCote d'IvoireCroatiaCubaCyprusCzech RepublicDenmarkDjiboutiDominicaDominican RepublicEarly-demographic dividendEast Asia & PacificEast Asia & Pacific (excluding high income)East Asia & Pacific (IDA & IBRD countries)EcuadorEgypt, Arab Rep.El SalvadorEquatorial GuineaEritreaEstoniaEthiopiaEuro areaEurope & Central AsiaEurope & Central Asia (excluding high income)Europe & Central Asia (IDA & IBRD countries)European UnionFijiFinlandFragile and conflict affected situationsFranceFrench PolynesiaGabonGambia, TheGeorgiaGermanyGhanaGreeceGreenlandGrenadaGuatemalaGuineaGuinea-BissauGuyanaHaitiHeavily indebted poor countries (HIPC)High incomeHondurasHong Kong SAR, ChinaHungaryIBRD onlyIcelandIDA & IBRD totalIDA blendIDA onlyIDA totalIndiaIndonesiaIran, Islamic Rep.IraqIrelandIsle of ManIsraelItalyJamaicaJapanJordanKazakhstanKenyaKiribatiKorea, Rep.KosovoKuwaitKyrgyz RepublicLao PDRLate-demographic dividendLatin America & Caribbean Latin America & Caribbean (excluding high income)Latin America & the Caribbean (IDA & IBRD countries)LatviaLeast developed countries: UN classificationLebanonLesothoLiberiaLibyaLiechtensteinLithuaniaLow & middle incomeLow incomeLower middle incomeLuxembourgMacao SAR, ChinaMacedonia, FYRMadagascarMalawiMalaysiaMaldivesMaliMaltaMarshall IslandsMauritaniaMauritiusMexicoMicronesia, Fed. Sts.Middle East & North AfricaMiddle East & North Africa (excluding high income)Middle East & North Africa (IDA & IBRD countries)Middle incomeMoldovaMonacoMongoliaMontenegroMoroccoMozambiqueMyanmarNamibiaNauruNepalNetherlandsNew CaledoniaNew ZealandNicaraguaNigerNigeriaNorth AmericaNorwayOECD membersOmanOther small statesPacific island small statesPakistanPalauPanamaPapua New GuineaParaguayPeruPhilippinesPolandPortugalPost-demographic dividendPre-demographic dividendPuerto RicoQatarRomaniaRussian FederationRwandaSamoaSan MarinoSao Tome and PrincipeSaudi ArabiaSenegalSerbiaSeychellesSierra LeoneSingaporeSlovak RepublicSloveniaSmall statesSolomon IslandsSouth AfricaSouth AsiaSouth Asia (IDA & IBRD)South SudanSpainSri LankaSt. Kitts and NevisSt. LuciaSt. Vincent and the GrenadinesSub-Saharan Africa Sub-Saharan Africa (excluding high income)Sub-Saharan Africa (IDA & IBRD countries)SudanSurinameSwazilandSwedenSwitzerlandSyrian Arab RepublicTajikistanTanzaniaThailandTimor-LesteTogoTongaTrinidad and TobagoTunisiaTurkeyTurkmenistanTuvaluUgandaUkraineUnited Arab EmiratesUnited KingdomUnited StatesUpper middle incomeUruguayUzbekistanVanuatuVenezuela, RBVietnamVirgin Islands (U.S.)West Bank and GazaWorldYemen, Rep.ZambiaZimbabwe Timeline:
This timeline shows a graph from 1972 to 2016 of Argentina. No data until 1971. Number of actual observations by date: 45.
Source name:
World Development Indicators
Source organization:
World Bank national accounts data, and OECD National Accounts data files.
Categories, topics:
Economy & Growth
Last updated:
apr 23, 2017
Indicators value changes by year
Minimum:
31.069 bln
jan 1, 1974
Maximum:
546.425 bln
jan 1, 2014
At the date of observation
Value
Absolute change
Change from previous value
jan 1, 1972
50.452 bln
+50.452 bln
0.0%
jan 1, 1973
32.655 bln
-17.796 bln
-35.27%
jan 1, 1974
31.069 bln
-1.586 bln
-4.86%
jan 1, 1975
54.004 bln
+22.935 bln
73.82%
jan 1, 1976
63.997 bln
+9.993 bln
18.5%
jan 1, 1977
58.667 bln
-5.331 bln
-8.33%
jan 1, 1978
57.656 bln
-1.011 bln
-1.72%
jan 1, 1979
59.257 bln
+1.601 bln
2.78%
jan 1, 1980
72.112 bln
+12.856 bln
21.69%
jan 1, 1981
82.66 bln
+10.548 bln
14.63%
jan 1, 1982
80.147 bln
-2.514 bln
-3.04%
jan 1, 1983
74.565 bln
-5.581 bln
-6.96%
jan 1, 1984
82.33 bln
+7.765 bln
10.41%
jan 1, 1985
84.268 bln
+1.938 bln
2.35%
jan 1, 1986
80.454 bln
-3.814 bln
-4.53%
jan 1, 1987
92.857 bln
+12.403 bln
15.42%
jan 1, 1988
112.638 bln
+19.781 bln
21.3%
jan 1, 1989
124.116 bln
+11.478 bln
10.19%
jan 1, 1990
93.73 bln
-30.386 bln
-24.48%
jan 1, 1991
103.87 bln
+10.14 bln
10.82%
jan 1, 1992
131.014 bln
+27.144 bln
26.13%
jan 1, 1993
211.262 bln
+80.248 bln
61.25%
jan 1, 1994
241.273 bln
+30.011 bln
14.21%
jan 1, 1995
260.408 bln
+19.135 bln
7.93%
jan 1, 1996
256.347 bln
-4.061 bln
-1.56%
jan 1, 1997
272.664 bln
+16.317 bln
6.37%
jan 1, 1998
290.495 bln
+17.832 bln
6.54%
jan 1, 1999
289.537 bln
-958.747 mln
-0.33%
jan 1, 2000
276.294 bln
-13.242 bln
-4.57%
jan 1, 2001
275.544 bln
-750.136 mln
-0.27%
jan 1, 2002
260.812 bln
-14.733 bln
-5.35%
jan 1, 2003
148.963 bln
-111.849 bln
-42.88%
jan 1, 2004
136.125 bln
-12.838 bln
-8.62%
jan 1, 2005
137.683 bln
+1.558 bln
1.14%
jan 1, 2006
180.172 bln
+42.488 bln
30.86%
jan 1, 2007
217.483 bln
+37.312 bln
20.71%
jan 1, 2008
260.978 bln
+43.495 bln
20.0%
jan 1, 2009
309.956 bln
+48.977 bln
18.77%
jan 1, 2010
317.997 bln
+8.041 bln
2.59%
jan 1, 2011
381.029 bln
+63.032 bln
19.82%
jan 1, 2012
446.27 bln
+65.241 bln
17.12%
jan 1, 2013
499.782 bln
+53.512 bln
11.99%
jan 1, 2014
546.425 bln
+46.643 bln
9.33%
jan 1, 2015
530.063 bln
-16.362 bln
-2.99%
jan 1, 2016
541.108 bln
+11.045 bln
2.08%
Ranking of countries by current statistics by years


Comments: