29
/
en
AIzaSyAYiBZKx7MnpbEhh9jyipgxe19OcubqV5w
April 1, 2024
215304
Oman
OMN
true
2
1
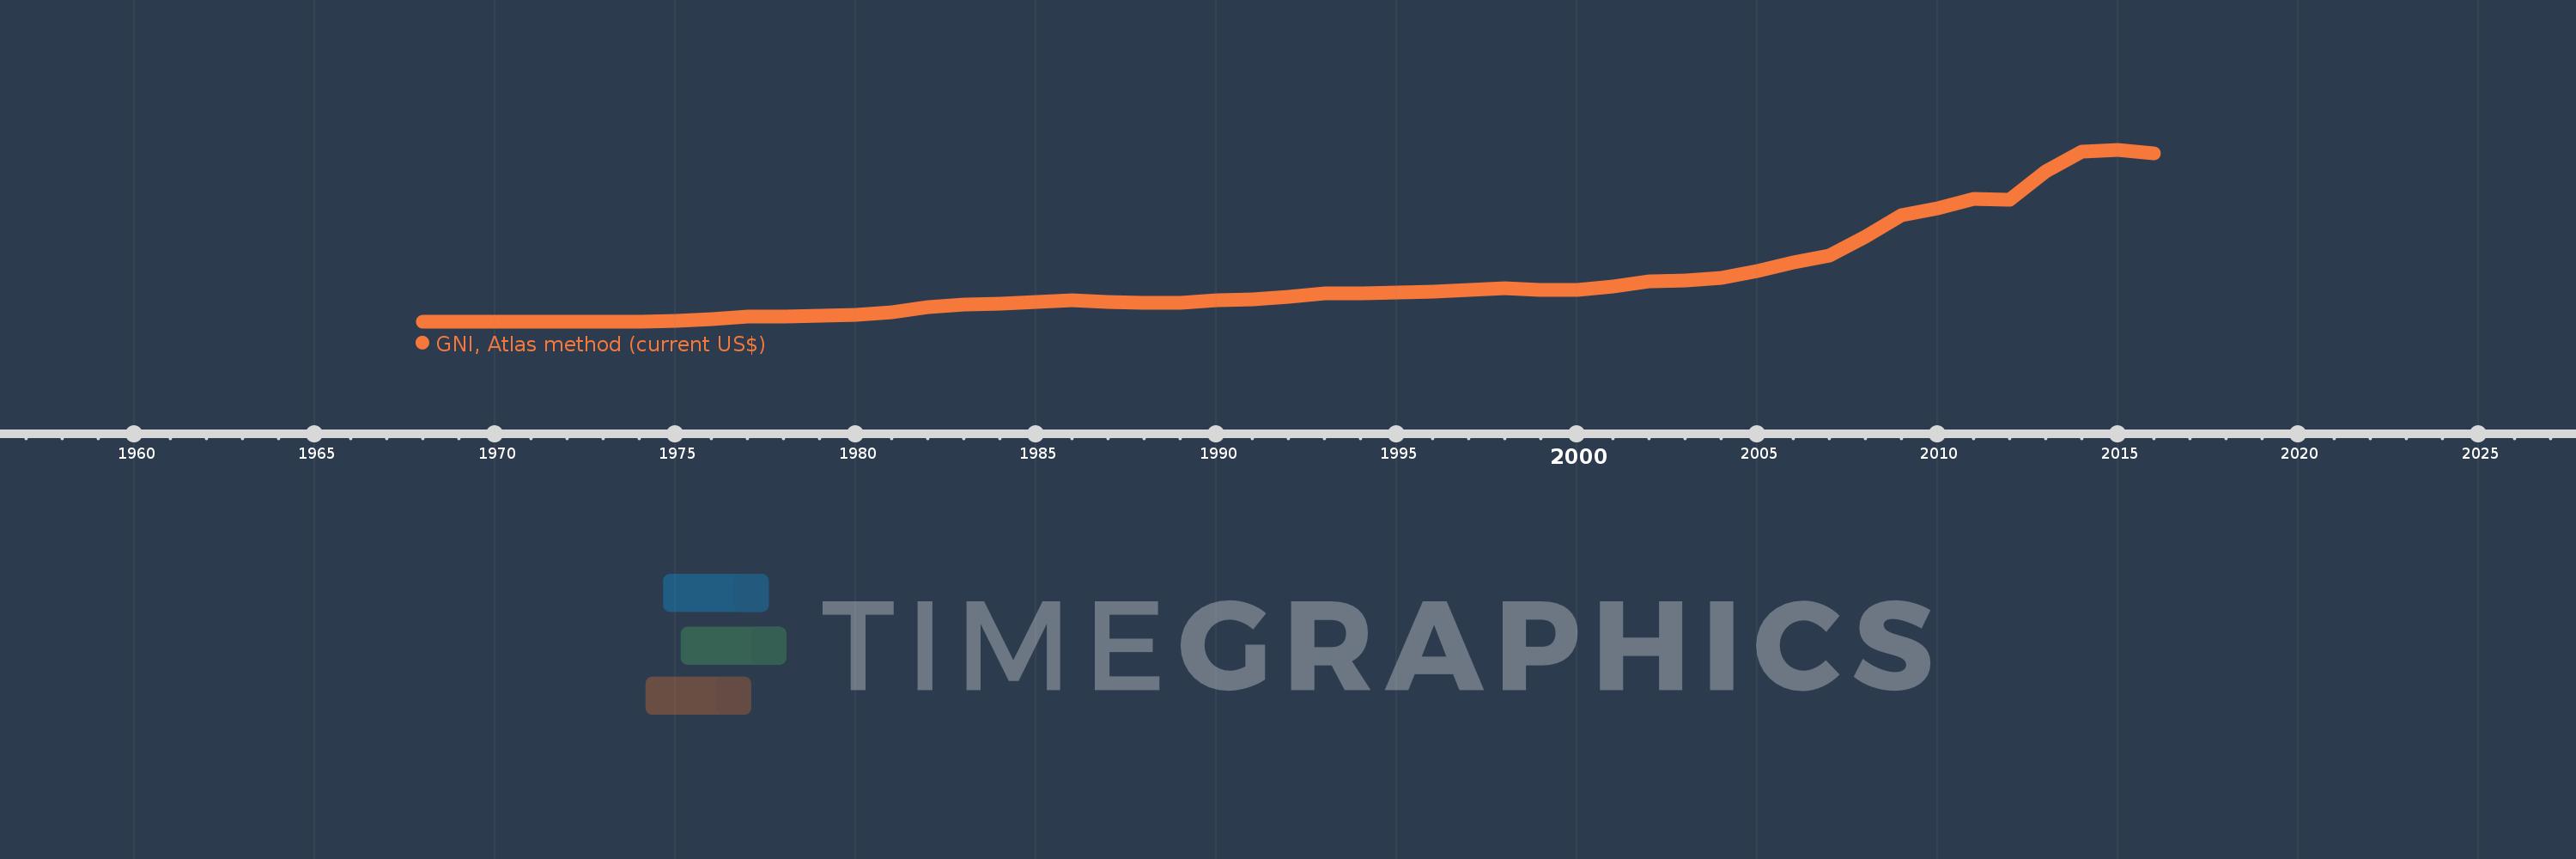
GNI, Atlas method (current US$)
2016,2015,2014,2013,2012,2011,2010,2009,2008,2007,2006,2005,2004,2003,2002,2001,2000,1999,1998,1997,1996,1995,1994,1993,1992,1991,1990,1989,1988,1987,1986,1985,1984,1983,1982,1981,1980,1979,1978,1977,1976,1975,1974,1973,1972,1971,1970,1969,1968
This statistics in other country:
AfghanistanAlbaniaAlgeriaAndorraAngolaAntigua and BarbudaArab WorldArgentinaArmeniaAustraliaAustriaAzerbaijanBahamas, TheBahrainBangladeshBarbadosBelarusBelgiumBelizeBeninBermudaBhutanBoliviaBosnia and HerzegovinaBotswanaBrazilBrunei DarussalamBulgariaBurkina FasoBurundiCabo VerdeCambodiaCameroonCanadaCaribbean small statesCentral African RepublicCentral Europe and the BalticsChadChannel IslandsChileChinaColombiaComorosCongo, Dem. Rep.Congo, Rep.Costa RicaCote d'IvoireCroatiaCubaCyprusCzech RepublicDenmarkDjiboutiDominicaDominican RepublicEarly-demographic dividendEast Asia & PacificEast Asia & Pacific (excluding high income)East Asia & Pacific (IDA & IBRD countries)EcuadorEgypt, Arab Rep.El SalvadorEquatorial GuineaEritreaEstoniaEthiopiaEuro areaEurope & Central AsiaEurope & Central Asia (excluding high income)Europe & Central Asia (IDA & IBRD countries)European UnionFijiFinlandFragile and conflict affected situationsFranceFrench PolynesiaGabonGambia, TheGeorgiaGermanyGhanaGreeceGreenlandGrenadaGuatemalaGuineaGuinea-BissauGuyanaHaitiHeavily indebted poor countries (HIPC)High incomeHondurasHong Kong SAR, ChinaHungaryIBRD onlyIcelandIDA & IBRD totalIDA blendIDA onlyIDA totalIndiaIndonesiaIran, Islamic Rep.IraqIrelandIsle of ManIsraelItalyJamaicaJapanJordanKazakhstanKenyaKiribatiKorea, Rep.KosovoKuwaitKyrgyz RepublicLao PDRLate-demographic dividendLatin America & Caribbean Latin America & Caribbean (excluding high income)Latin America & the Caribbean (IDA & IBRD countries)LatviaLeast developed countries: UN classificationLebanonLesothoLiberiaLibyaLiechtensteinLithuaniaLow & middle incomeLow incomeLower middle incomeLuxembourgMacao SAR, ChinaMacedonia, FYRMadagascarMalawiMalaysiaMaldivesMaliMaltaMarshall IslandsMauritaniaMauritiusMexicoMicronesia, Fed. Sts.Middle East & North AfricaMiddle East & North Africa (excluding high income)Middle East & North Africa (IDA & IBRD countries)Middle incomeMoldovaMonacoMongoliaMontenegroMoroccoMozambiqueMyanmarNamibiaNauruNepalNetherlandsNew CaledoniaNew ZealandNicaraguaNigerNigeriaNorth AmericaNorwayOECD membersOmanOther small statesPacific island small statesPakistanPalauPanamaPapua New GuineaParaguayPeruPhilippinesPolandPortugalPost-demographic dividendPre-demographic dividendPuerto RicoQatarRomaniaRussian FederationRwandaSamoaSan MarinoSao Tome and PrincipeSaudi ArabiaSenegalSerbiaSeychellesSierra LeoneSingaporeSlovak RepublicSloveniaSmall statesSolomon IslandsSouth AfricaSouth AsiaSouth Asia (IDA & IBRD)South SudanSpainSri LankaSt. Kitts and NevisSt. LuciaSt. Vincent and the GrenadinesSub-Saharan Africa Sub-Saharan Africa (excluding high income)Sub-Saharan Africa (IDA & IBRD countries)SudanSurinameSwazilandSwedenSwitzerlandSyrian Arab RepublicTajikistanTanzaniaThailandTimor-LesteTogoTongaTrinidad and TobagoTunisiaTurkeyTurkmenistanTuvaluUgandaUkraineUnited Arab EmiratesUnited KingdomUnited StatesUpper middle incomeUruguayUzbekistanVanuatuVenezuela, RBVietnamVirgin Islands (U.S.)West Bank and GazaWorldYemen, Rep.ZambiaZimbabwe Timeline:
This timeline shows a graph from 1968 to 2016 of Oman. No data until 1967. Number of actual observations by date: 49.
Source name:
World Development Indicators
Source organization:
World Bank national accounts data, and OECD National Accounts data files.
Categories, topics:
Economy & Growth
Last updated:
apr 23, 2017
Indicators value changes by year
Minimum:
103.028 mln
jan 1, 1968
Maximum:
77.19 bln
jan 1, 2015
At the date of observation
Value
Absolute change
Change from previous value
jan 1, 1968
103.028 mln
+103.028 mln
0.0%
jan 1, 1969
154.36 mln
+51.332 mln
49.82%
jan 1, 1970
193.574 mln
+39.214 mln
25.4%
jan 1, 1971
232.117 mln
+38.543 mln
19.91%
jan 1, 1972
246.388 mln
+14.271 mln
6.15%
jan 1, 1973
277.67 mln
+31.282 mln
12.7%
jan 1, 1974
248.467 mln
-29.203 mln
-10.52%
jan 1, 1975
589.165 mln
+340.699 mln
137.12%
jan 1, 1976
1.336 bln
+746.547 mln
126.71%
jan 1, 1977
2.566 bln
+1.231 bln
92.13%
jan 1, 1978
2.657 bln
+90.731 mln
3.54%
jan 1, 1979
2.734 bln
+77.393 mln
2.91%
jan 1, 1980
3.355 bln
+620.493 mln
22.69%
jan 1, 1981
4.573 bln
+1.218 bln
36.3%
jan 1, 1982
6.684 bln
+2.111 bln
46.17%
jan 1, 1983
8.012 bln
+1.328 bln
19.87%
jan 1, 1984
8.38 bln
+368.038 mln
4.59%
jan 1, 1985
9.048 bln
+667.524 mln
7.97%
jan 1, 1986
9.833 bln
+785.06 mln
8.68%
jan 1, 1987
9.262 bln
-570.78 mln
-5.8%
jan 1, 1988
8.73 bln
-532.088 mln
-5.74%
jan 1, 1989
8.737 bln
+6.983 mln
0.08%
jan 1, 1990
9.863 bln
+1.126 bln
12.89%
jan 1, 1991
10.344 bln
+480.054 mln
4.87%
jan 1, 1992
11.434 bln
+1.091 bln
10.54%
jan 1, 1993
12.906 bln
+1.472 bln
12.87%
jan 1, 1994
13.022 bln
+115.513 mln
0.9%
jan 1, 1995
13.228 bln
+206.648 mln
1.59%
jan 1, 1996
13.829 bln
+600.849 mln
4.54%
jan 1, 1997
14.482 bln
+652.666 mln
4.72%
jan 1, 1998
15.32 bln
+838.147 mln
5.79%
jan 1, 1999
14.611 bln
-709.144 mln
-4.63%
jan 1, 2000
14.375 bln
-235.184 mln
-1.61%
jan 1, 2001
16.044 bln
+1.668 bln
11.6%
jan 1, 2002
18.182 bln
+2.138 bln
13.33%
jan 1, 2003
18.575 bln
+393.027 mln
2.16%
jan 1, 2004
19.697 bln
+1.122 bln
6.04%
jan 1, 2005
22.932 bln
+3.235 bln
16.43%
jan 1, 2006
26.68 bln
+3.748 bln
16.35%
jan 1, 2007
29.709 bln
+3.029 bln
11.35%
jan 1, 2008
38.505 bln
+8.796 bln
29.61%
jan 1, 2009
47.947 bln
+9.442 bln
24.52%
jan 1, 2010
51.036 bln
+3.089 bln
6.44%
jan 1, 2011
55.258 bln
+4.222 bln
8.27%
jan 1, 2012
55.061 bln
-197.02 mln
-0.36%
jan 1, 2013
67.724 bln
+12.663 bln
23.0%
jan 1, 2014
76.394 bln
+8.67 bln
12.8%
jan 1, 2015
77.19 bln
+795.407 mln
1.04%
jan 1, 2016
75.933 bln
-1.256 bln
-1.63%
Ranking of countries by current statistics by years


Comments: