29
/
en
AIzaSyAYiBZKx7MnpbEhh9jyipgxe19OcubqV5w
April 1, 2024
144400
Guatemala
GTM
true
2
1
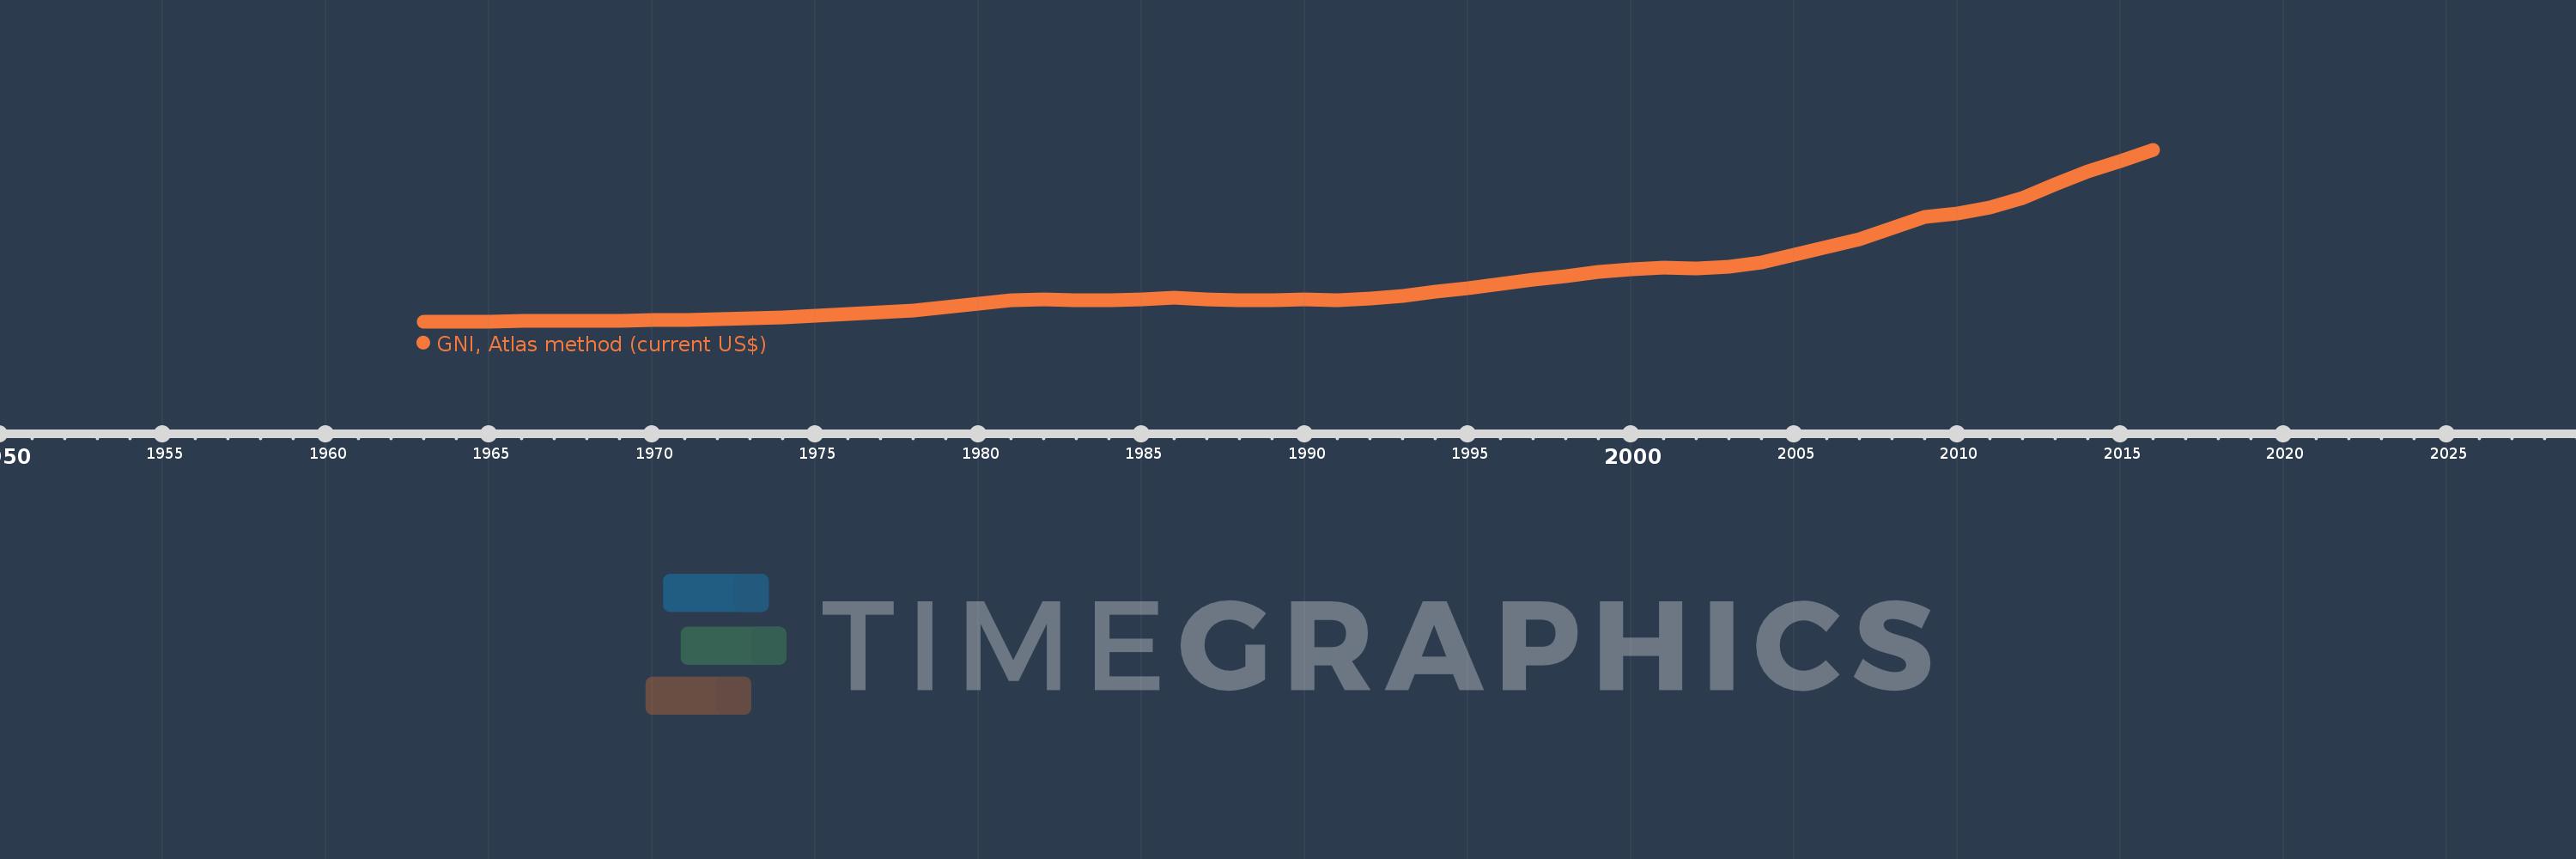
GNI, Atlas method (current US$)
2016,2015,2014,2013,2012,2011,2010,2009,2008,2007,2006,2005,2004,2003,2002,2001,2000,1999,1998,1997,1996,1995,1994,1993,1992,1991,1990,1989,1988,1987,1986,1985,1984,1983,1982,1981,1980,1979,1978,1977,1976,1975,1974,1973,1972,1971,1970,1969,1968,1967,1966,1965,1964,1963
This statistics in other country:
AfghanistanAlbaniaAlgeriaAndorraAngolaAntigua and BarbudaArab WorldArgentinaArmeniaAustraliaAustriaAzerbaijanBahamas, TheBahrainBangladeshBarbadosBelarusBelgiumBelizeBeninBermudaBhutanBoliviaBosnia and HerzegovinaBotswanaBrazilBrunei DarussalamBulgariaBurkina FasoBurundiCabo VerdeCambodiaCameroonCanadaCaribbean small statesCentral African RepublicCentral Europe and the BalticsChadChannel IslandsChileChinaColombiaComorosCongo, Dem. Rep.Congo, Rep.Costa RicaCote d'IvoireCroatiaCubaCyprusCzech RepublicDenmarkDjiboutiDominicaDominican RepublicEarly-demographic dividendEast Asia & PacificEast Asia & Pacific (excluding high income)East Asia & Pacific (IDA & IBRD countries)EcuadorEgypt, Arab Rep.El SalvadorEquatorial GuineaEritreaEstoniaEthiopiaEuro areaEurope & Central AsiaEurope & Central Asia (excluding high income)Europe & Central Asia (IDA & IBRD countries)European UnionFijiFinlandFragile and conflict affected situationsFranceFrench PolynesiaGabonGambia, TheGeorgiaGermanyGhanaGreeceGreenlandGrenadaGuatemalaGuineaGuinea-BissauGuyanaHaitiHeavily indebted poor countries (HIPC)High incomeHondurasHong Kong SAR, ChinaHungaryIBRD onlyIcelandIDA & IBRD totalIDA blendIDA onlyIDA totalIndiaIndonesiaIran, Islamic Rep.IraqIrelandIsle of ManIsraelItalyJamaicaJapanJordanKazakhstanKenyaKiribatiKorea, Rep.KosovoKuwaitKyrgyz RepublicLao PDRLate-demographic dividendLatin America & Caribbean Latin America & Caribbean (excluding high income)Latin America & the Caribbean (IDA & IBRD countries)LatviaLeast developed countries: UN classificationLebanonLesothoLiberiaLibyaLiechtensteinLithuaniaLow & middle incomeLow incomeLower middle incomeLuxembourgMacao SAR, ChinaMacedonia, FYRMadagascarMalawiMalaysiaMaldivesMaliMaltaMarshall IslandsMauritaniaMauritiusMexicoMicronesia, Fed. Sts.Middle East & North AfricaMiddle East & North Africa (excluding high income)Middle East & North Africa (IDA & IBRD countries)Middle incomeMoldovaMonacoMongoliaMontenegroMoroccoMozambiqueMyanmarNamibiaNauruNepalNetherlandsNew CaledoniaNew ZealandNicaraguaNigerNigeriaNorth AmericaNorwayOECD membersOmanOther small statesPacific island small statesPakistanPalauPanamaPapua New GuineaParaguayPeruPhilippinesPolandPortugalPost-demographic dividendPre-demographic dividendPuerto RicoQatarRomaniaRussian FederationRwandaSamoaSan MarinoSao Tome and PrincipeSaudi ArabiaSenegalSerbiaSeychellesSierra LeoneSingaporeSlovak RepublicSloveniaSmall statesSolomon IslandsSouth AfricaSouth AsiaSouth Asia (IDA & IBRD)South SudanSpainSri LankaSt. Kitts and NevisSt. LuciaSt. Vincent and the GrenadinesSub-Saharan Africa Sub-Saharan Africa (excluding high income)Sub-Saharan Africa (IDA & IBRD countries)SudanSurinameSwazilandSwedenSwitzerlandSyrian Arab RepublicTajikistanTanzaniaThailandTimor-LesteTogoTongaTrinidad and TobagoTunisiaTurkeyTurkmenistanTuvaluUgandaUkraineUnited Arab EmiratesUnited KingdomUnited StatesUpper middle incomeUruguayUzbekistanVanuatuVenezuela, RBVietnamVirgin Islands (U.S.)West Bank and GazaWorldYemen, Rep.ZambiaZimbabwe Timeline:
This timeline shows a graph from 1963 to 2016 of Guatemala. No data until 1962. Number of actual observations by date: 54.
Source name:
World Development Indicators
Source organization:
World Bank national accounts data, and OECD National Accounts data files.
Categories, topics:
Economy & Growth
Last updated:
apr 23, 2017
Indicators value changes by year
Minimum:
1.136 bln
jan 1, 1963
Maximum:
58.636 bln
jan 1, 2016
At the date of observation
Value
Absolute change
Change from previous value
jan 1, 1963
1.136 bln
+1.136 bln
0.0%
jan 1, 1964
1.252 bln
+115.124 mln
10.13%
jan 1, 1965
1.314 bln
+62.21 mln
4.97%
jan 1, 1966
1.374 bln
+60.628 mln
4.61%
jan 1, 1967
1.434 bln
+59.795 mln
4.35%
jan 1, 1968
1.481 bln
+46.498 mln
3.24%
jan 1, 1969
1.625 bln
+144.136 mln
9.73%
jan 1, 1970
1.732 bln
+107.335 mln
6.61%
jan 1, 1971
1.889 bln
+156.987 mln
9.06%
jan 1, 1972
2.036 bln
+146.72 mln
7.77%
jan 1, 1973
2.237 bln
+201.189 mln
9.88%
jan 1, 1974
2.627 bln
+389.988 mln
17.43%
jan 1, 1975
3.21 bln
+583.056 mln
22.19%
jan 1, 1976
3.749 bln
+538.98 mln
16.79%
jan 1, 1977
4.307 bln
+557.885 mln
14.88%
jan 1, 1978
5.103 bln
+796.135 mln
18.48%
jan 1, 1979
6.04 bln
+936.472 mln
18.35%
jan 1, 1980
7.273 bln
+1.234 bln
20.43%
jan 1, 1981
8.314 bln
+1.04 bln
14.3%
jan 1, 1982
8.795 bln
+481.393 mln
5.79%
jan 1, 1983
8.493 bln
-302.046 mln
-3.43%
jan 1, 1984
8.31 bln
-182.738 mln
-2.15%
jan 1, 1985
8.671 bln
+361.126 mln
4.35%
jan 1, 1986
9.184 bln
+512.481 mln
5.91%
jan 1, 1987
8.689 bln
-495.323 mln
-5.39%
jan 1, 1988
8.503 bln
-185.825 mln
-2.14%
jan 1, 1989
8.423 bln
-79.459 mln
-0.93%
jan 1, 1990
8.588 bln
+164.26 mln
1.95%
jan 1, 1991
8.481 bln
-106.334 mln
-1.24%
jan 1, 1992
8.996 bln
+515.073 mln
6.07%
jan 1, 1993
9.851 bln
+854.358 mln
9.5%
jan 1, 1994
11.177 bln
+1.326 bln
13.46%
jan 1, 1995
12.331 bln
+1.154 bln
10.33%
jan 1, 1996
13.959 bln
+1.628 bln
13.2%
jan 1, 1997
15.18 bln
+1.221 bln
8.74%
jan 1, 1998
16.541 bln
+1.361 bln
8.97%
jan 1, 1999
17.854 bln
+1.314 bln
7.94%
jan 1, 2000
18.722 bln
+868.151 mln
4.86%
jan 1, 2001
19.388 bln
+665.167 mln
3.55%
jan 1, 2002
19.123 bln
-264.996 mln
-1.37%
jan 1, 2003
19.718 bln
+595.568 mln
3.11%
jan 1, 2004
21.102 bln
+1.384 bln
7.02%
jan 1, 2005
23.788 bln
+2.686 bln
12.73%
jan 1, 2006
26.274 bln
+2.485 bln
10.45%
jan 1, 2007
28.913 bln
+2.639 bln
10.04%
jan 1, 2008
32.433 bln
+3.52 bln
12.18%
jan 1, 2009
36.162 bln
+3.729 bln
11.5%
jan 1, 2010
37.402 bln
+1.24 bln
3.43%
jan 1, 2011
39.476 bln
+2.074 bln
5.54%
jan 1, 2012
42.578 bln
+3.103 bln
7.86%
jan 1, 2013
47.188 bln
+4.61 bln
10.83%
jan 1, 2014
51.678 bln
+4.49 bln
9.52%
jan 1, 2015
55.025 bln
+3.346 bln
6.48%
jan 1, 2016
58.636 bln
+3.611 bln
6.56%
Ranking of countries by current statistics by years


Comments: