29
/
en
AIzaSyAYiBZKx7MnpbEhh9jyipgxe19OcubqV5w
April 1, 2024
182956
Macao SAR, China
MAC
true
2
1
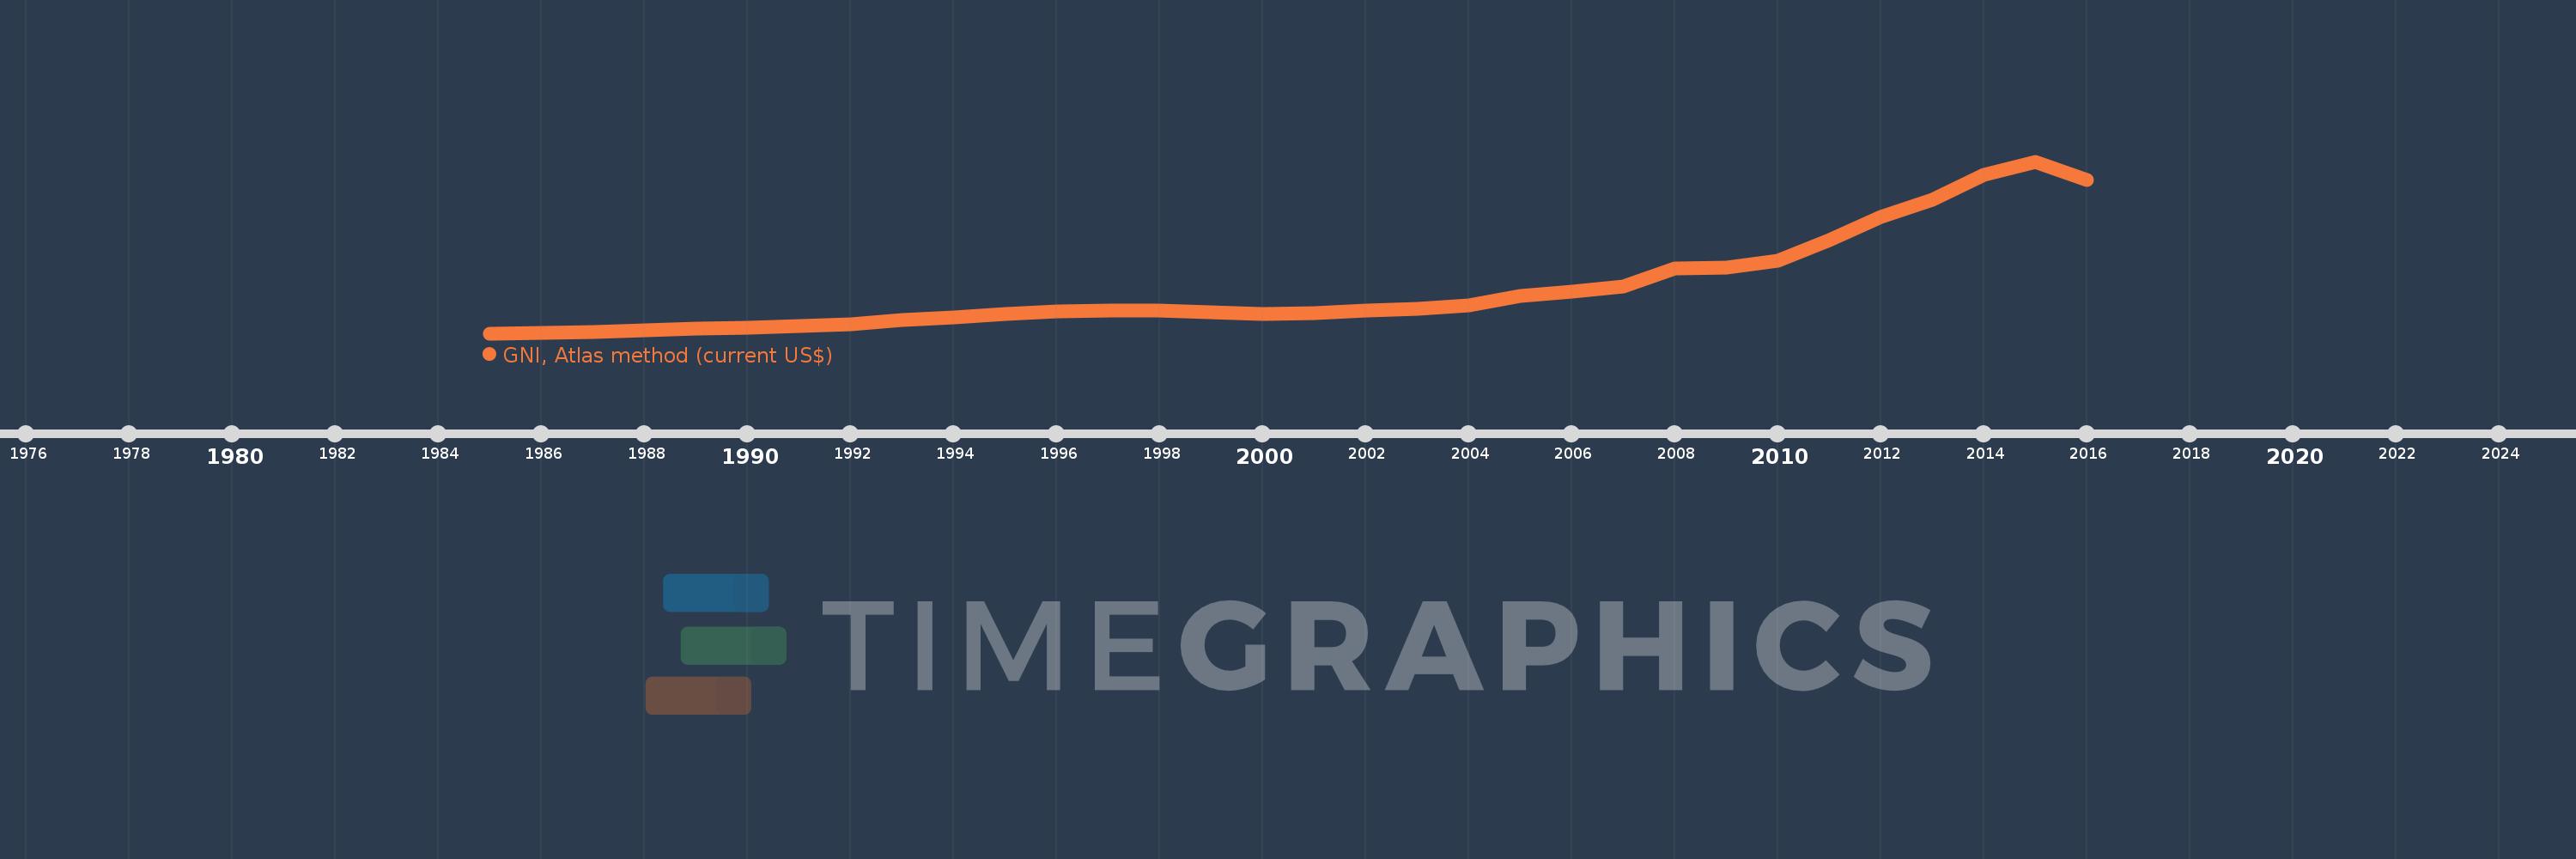
GNI, Atlas method (current US$)
2016,2015,2014,2013,2012,2011,2010,2009,2008,2007,2006,2005,2004,2003,2002,2001,2000,1999,1998,1997,1996,1995,1994,1993,1992,1991,1990,1989,1988,1987,1986,1985
This statistics in other country:
AfghanistanAlbaniaAlgeriaAndorraAngolaAntigua and BarbudaArab WorldArgentinaArmeniaAustraliaAustriaAzerbaijanBahamas, TheBahrainBangladeshBarbadosBelarusBelgiumBelizeBeninBermudaBhutanBoliviaBosnia and HerzegovinaBotswanaBrazilBrunei DarussalamBulgariaBurkina FasoBurundiCabo VerdeCambodiaCameroonCanadaCaribbean small statesCentral African RepublicCentral Europe and the BalticsChadChannel IslandsChileChinaColombiaComorosCongo, Dem. Rep.Congo, Rep.Costa RicaCote d'IvoireCroatiaCubaCyprusCzech RepublicDenmarkDjiboutiDominicaDominican RepublicEarly-demographic dividendEast Asia & PacificEast Asia & Pacific (excluding high income)East Asia & Pacific (IDA & IBRD countries)EcuadorEgypt, Arab Rep.El SalvadorEquatorial GuineaEritreaEstoniaEthiopiaEuro areaEurope & Central AsiaEurope & Central Asia (excluding high income)Europe & Central Asia (IDA & IBRD countries)European UnionFijiFinlandFragile and conflict affected situationsFranceFrench PolynesiaGabonGambia, TheGeorgiaGermanyGhanaGreeceGreenlandGrenadaGuatemalaGuineaGuinea-BissauGuyanaHaitiHeavily indebted poor countries (HIPC)High incomeHondurasHong Kong SAR, ChinaHungaryIBRD onlyIcelandIDA & IBRD totalIDA blendIDA onlyIDA totalIndiaIndonesiaIran, Islamic Rep.IraqIrelandIsle of ManIsraelItalyJamaicaJapanJordanKazakhstanKenyaKiribatiKorea, Rep.KosovoKuwaitKyrgyz RepublicLao PDRLate-demographic dividendLatin America & Caribbean Latin America & Caribbean (excluding high income)Latin America & the Caribbean (IDA & IBRD countries)LatviaLeast developed countries: UN classificationLebanonLesothoLiberiaLibyaLiechtensteinLithuaniaLow & middle incomeLow incomeLower middle incomeLuxembourgMacao SAR, ChinaMacedonia, FYRMadagascarMalawiMalaysiaMaldivesMaliMaltaMarshall IslandsMauritaniaMauritiusMexicoMicronesia, Fed. Sts.Middle East & North AfricaMiddle East & North Africa (excluding high income)Middle East & North Africa (IDA & IBRD countries)Middle incomeMoldovaMonacoMongoliaMontenegroMoroccoMozambiqueMyanmarNamibiaNauruNepalNetherlandsNew CaledoniaNew ZealandNicaraguaNigerNigeriaNorth AmericaNorwayOECD membersOmanOther small statesPacific island small statesPakistanPalauPanamaPapua New GuineaParaguayPeruPhilippinesPolandPortugalPost-demographic dividendPre-demographic dividendPuerto RicoQatarRomaniaRussian FederationRwandaSamoaSan MarinoSao Tome and PrincipeSaudi ArabiaSenegalSerbiaSeychellesSierra LeoneSingaporeSlovak RepublicSloveniaSmall statesSolomon IslandsSouth AfricaSouth AsiaSouth Asia (IDA & IBRD)South SudanSpainSri LankaSt. Kitts and NevisSt. LuciaSt. Vincent and the GrenadinesSub-Saharan Africa Sub-Saharan Africa (excluding high income)Sub-Saharan Africa (IDA & IBRD countries)SudanSurinameSwazilandSwedenSwitzerlandSyrian Arab RepublicTajikistanTanzaniaThailandTimor-LesteTogoTongaTrinidad and TobagoTunisiaTurkeyTurkmenistanTuvaluUgandaUkraineUnited Arab EmiratesUnited KingdomUnited StatesUpper middle incomeUruguayUzbekistanVanuatuVenezuela, RBVietnamVirgin Islands (U.S.)West Bank and GazaWorldYemen, Rep.ZambiaZimbabwe Timeline:
This timeline shows a graph from 1985 to 2016 of Macao SAR, China. No data until 1984. Number of actual observations by date: 32.
Source name:
World Development Indicators
Source organization:
World Bank national accounts data, and OECD National Accounts data files.
Categories, topics:
Economy & Growth
Last updated:
apr 23, 2017
Indicators value changes by year
Minimum:
1.287 bln
jan 1, 1985
Maximum:
44.093 bln
jan 1, 2015
At the date of observation
Value
Absolute change
Change from previous value
jan 1, 1985
1.287 bln
+1.287 bln
0.0%
jan 1, 1986
1.309 bln
+22.019 mln
1.71%
jan 1, 1987
1.549 bln
+240.01 mln
18.34%
jan 1, 1988
1.986 bln
+437.052 mln
28.22%
jan 1, 1989
2.391 bln
+404.892 mln
20.39%
jan 1, 1990
2.681 bln
+290.371 mln
12.15%
jan 1, 1991
3.07 bln
+389.057 mln
14.51%
jan 1, 1992
3.53 bln
+460.038 mln
14.99%
jan 1, 1993
4.517 bln
+987.292 mln
27.97%
jan 1, 1994
5.274 bln
+756.727 mln
16.75%
jan 1, 1995
6.069 bln
+794.646 mln
15.07%
jan 1, 1996
6.722 bln
+653.078 mln
10.76%
jan 1, 1997
6.917 bln
+194.858 mln
2.9%
jan 1, 1998
7.0 bln
+83.354 mln
1.21%
jan 1, 1999
6.479 bln
-520.915 mln
-7.44%
jan 1, 2000
6.17 bln
-308.922 mln
-4.77%
jan 1, 2001
6.321 bln
+151.317 mln
2.45%
jan 1, 2002
6.991 bln
+669.765 mln
10.6%
jan 1, 2003
7.374 bln
+382.447 mln
5.47%
jan 1, 2004
8.223 bln
+849.438 mln
11.52%
jan 1, 2005
10.494 bln
+2.271 bln
27.61%
jan 1, 2006
11.593 bln
+1.1 bln
10.48%
jan 1, 2007
12.992 bln
+1.399 bln
12.07%
jan 1, 2008
17.466 bln
+4.474 bln
34.44%
jan 1, 2009
17.723 bln
+256.481 mln
1.47%
jan 1, 2010
19.337 bln
+1.614 bln
9.11%
jan 1, 2011
24.533 bln
+5.196 bln
26.87%
jan 1, 2012
30.19 bln
+5.657 bln
23.06%
jan 1, 2013
34.526 bln
+4.336 bln
14.36%
jan 1, 2014
40.684 bln
+6.158 bln
17.83%
jan 1, 2015
44.093 bln
+3.409 bln
8.38%
jan 1, 2016
39.475 bln
-4.618 bln
-10.47%
Ranking of countries by current statistics by years


Comments: