29
/
en
AIzaSyAYiBZKx7MnpbEhh9jyipgxe19OcubqV5w
April 1, 2024
32630
Europe & Central Asia (IDA & IBRD countries)
TEC
false
2
1
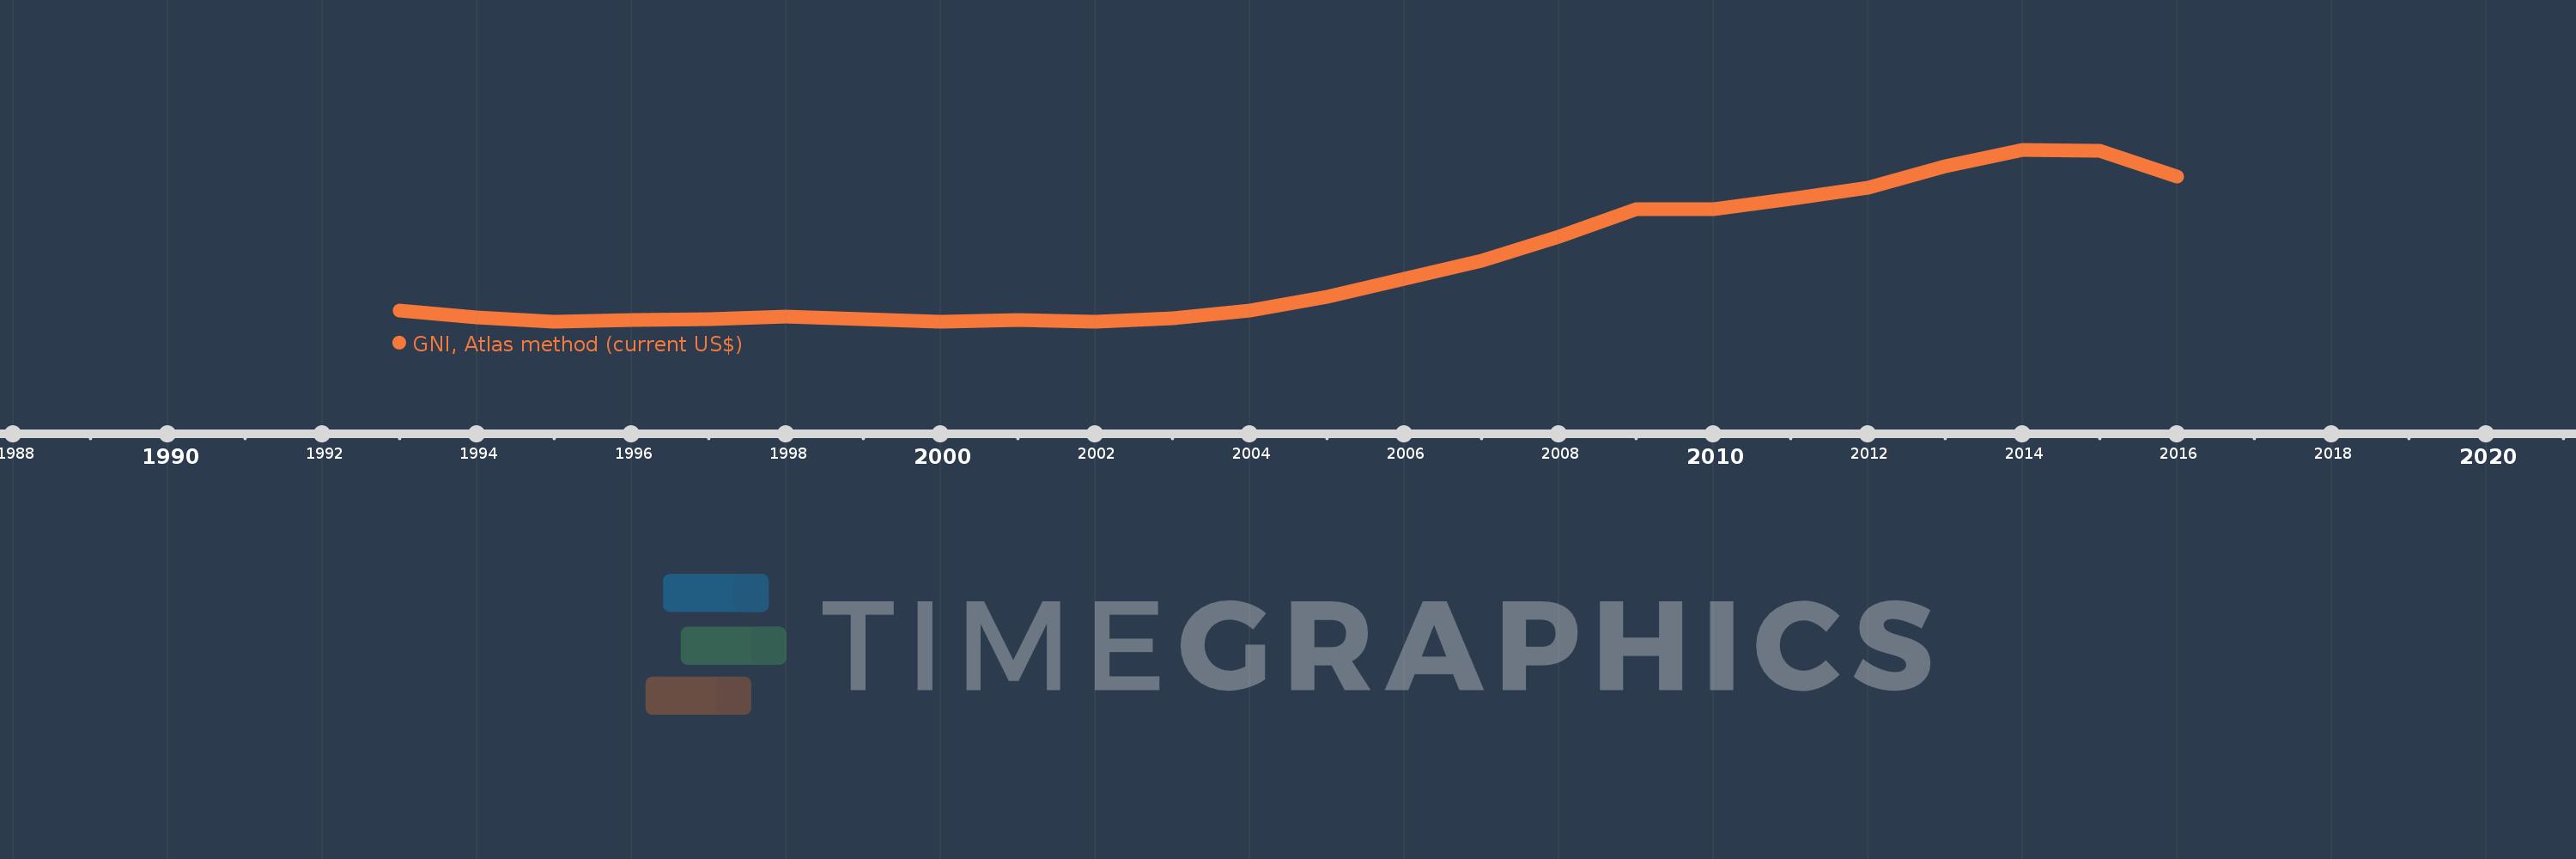
GNI, Atlas method (current US$)
2016,2015,2014,2013,2012,2011,2010,2009,2008,2007,2006,2005,2004,2003,2002,2001,2000,1999,1998,1997,1996,1995,1994,1993
This statistics in other country:
AfghanistanAlbaniaAlgeriaAndorraAngolaAntigua and BarbudaArab WorldArgentinaArmeniaAustraliaAustriaAzerbaijanBahamas, TheBahrainBangladeshBarbadosBelarusBelgiumBelizeBeninBermudaBhutanBoliviaBosnia and HerzegovinaBotswanaBrazilBrunei DarussalamBulgariaBurkina FasoBurundiCabo VerdeCambodiaCameroonCanadaCaribbean small statesCentral African RepublicCentral Europe and the BalticsChadChannel IslandsChileChinaColombiaComorosCongo, Dem. Rep.Congo, Rep.Costa RicaCote d'IvoireCroatiaCubaCyprusCzech RepublicDenmarkDjiboutiDominicaDominican RepublicEarly-demographic dividendEast Asia & PacificEast Asia & Pacific (excluding high income)East Asia & Pacific (IDA & IBRD countries)EcuadorEgypt, Arab Rep.El SalvadorEquatorial GuineaEritreaEstoniaEthiopiaEuro areaEurope & Central AsiaEurope & Central Asia (excluding high income)Europe & Central Asia (IDA & IBRD countries)European UnionFijiFinlandFragile and conflict affected situationsFranceFrench PolynesiaGabonGambia, TheGeorgiaGermanyGhanaGreeceGreenlandGrenadaGuatemalaGuineaGuinea-BissauGuyanaHaitiHeavily indebted poor countries (HIPC)High incomeHondurasHong Kong SAR, ChinaHungaryIBRD onlyIcelandIDA & IBRD totalIDA blendIDA onlyIDA totalIndiaIndonesiaIran, Islamic Rep.IraqIrelandIsle of ManIsraelItalyJamaicaJapanJordanKazakhstanKenyaKiribatiKorea, Rep.KosovoKuwaitKyrgyz RepublicLao PDRLate-demographic dividendLatin America & Caribbean Latin America & Caribbean (excluding high income)Latin America & the Caribbean (IDA & IBRD countries)LatviaLeast developed countries: UN classificationLebanonLesothoLiberiaLibyaLiechtensteinLithuaniaLow & middle incomeLow incomeLower middle incomeLuxembourgMacao SAR, ChinaMacedonia, FYRMadagascarMalawiMalaysiaMaldivesMaliMaltaMarshall IslandsMauritaniaMauritiusMexicoMicronesia, Fed. Sts.Middle East & North AfricaMiddle East & North Africa (excluding high income)Middle East & North Africa (IDA & IBRD countries)Middle incomeMoldovaMonacoMongoliaMontenegroMoroccoMozambiqueMyanmarNamibiaNauruNepalNetherlandsNew CaledoniaNew ZealandNicaraguaNigerNigeriaNorth AmericaNorwayOECD membersOmanOther small statesPacific island small statesPakistanPalauPanamaPapua New GuineaParaguayPeruPhilippinesPolandPortugalPost-demographic dividendPre-demographic dividendPuerto RicoQatarRomaniaRussian FederationRwandaSamoaSan MarinoSao Tome and PrincipeSaudi ArabiaSenegalSerbiaSeychellesSierra LeoneSingaporeSlovak RepublicSloveniaSmall statesSolomon IslandsSouth AfricaSouth AsiaSouth Asia (IDA & IBRD)South SudanSpainSri LankaSt. Kitts and NevisSt. LuciaSt. Vincent and the GrenadinesSub-Saharan Africa Sub-Saharan Africa (excluding high income)Sub-Saharan Africa (IDA & IBRD countries)SudanSurinameSwazilandSwedenSwitzerlandSyrian Arab RepublicTajikistanTanzaniaThailandTimor-LesteTogoTongaTrinidad and TobagoTunisiaTurkeyTurkmenistanTuvaluUgandaUkraineUnited Arab EmiratesUnited KingdomUnited StatesUpper middle incomeUruguayUzbekistanVanuatuVenezuela, RBVietnamVirgin Islands (U.S.)West Bank and GazaWorldYemen, Rep.ZambiaZimbabwe Timeline:
This timeline shows a graph from 1993 to 2016 of Europe & Central Asia (IDA & IBRD countries). No data until 1992. Number of actual observations by date: 24.
Source name:
World Development Indicators
Source organization:
World Bank national accounts data, and OECD National Accounts data files.
Categories, topics:
Economy & Growth
Last updated:
apr 23, 2017
Indicators value changes by year
Minimum:
856.551 bln
jan 1, 2000
Maximum:
4.513 trl
jan 1, 2014
At the date of observation
Value
Absolute change
Change from previous value
jan 1, 1993
1.097 trl
+1.097 trl
0.0%
jan 1, 1994
962.498 bln
-134.633 bln
-12.27%
jan 1, 1995
858.701 bln
-103.797 bln
-10.78%
jan 1, 1996
890.138 bln
+31.437 bln
3.66%
jan 1, 1997
919.23 bln
+29.092 bln
3.27%
jan 1, 1998
965.96 bln
+46.73 bln
5.08%
jan 1, 1999
908.977 bln
-56.983 bln
-5.9%
jan 1, 2000
856.551 bln
-52.426 bln
-5.77%
jan 1, 2001
895.967 bln
+39.416 bln
4.6%
jan 1, 2002
866.128 bln
-29.84 bln
-3.33%
jan 1, 2003
934.68 bln
+68.552 bln
7.91%
jan 1, 2004
1.094 trl
+159.422 bln
17.06%
jan 1, 2005
1.397 trl
+302.726 bln
27.67%
jan 1, 2006
1.769 trl
+372.138 bln
26.64%
jan 1, 2007
2.168 trl
+398.691 bln
22.54%
jan 1, 2008
2.673 trl
+505.126 bln
23.3%
jan 1, 2009
3.262 trl
+589.529 bln
22.06%
jan 1, 2010
3.25 trl
-12.294 bln
-0.38%
jan 1, 2011
3.472 trl
+222.013 bln
6.83%
jan 1, 2012
3.719 trl
+247.0 bln
7.11%
jan 1, 2013
4.163 trl
+444.166 bln
11.94%
jan 1, 2014
4.513 trl
+349.363 bln
8.39%
jan 1, 2015
4.503 trl
-9.528 bln
-0.21%
jan 1, 2016
3.951 trl
-552.152 bln
-12.26%
Ranking of countries by current statistics by years


Comments: