29
/
en
AIzaSyAYiBZKx7MnpbEhh9jyipgxe19OcubqV5w
April 1, 2024
110965
Congo, Rep.
COG
true
2
1
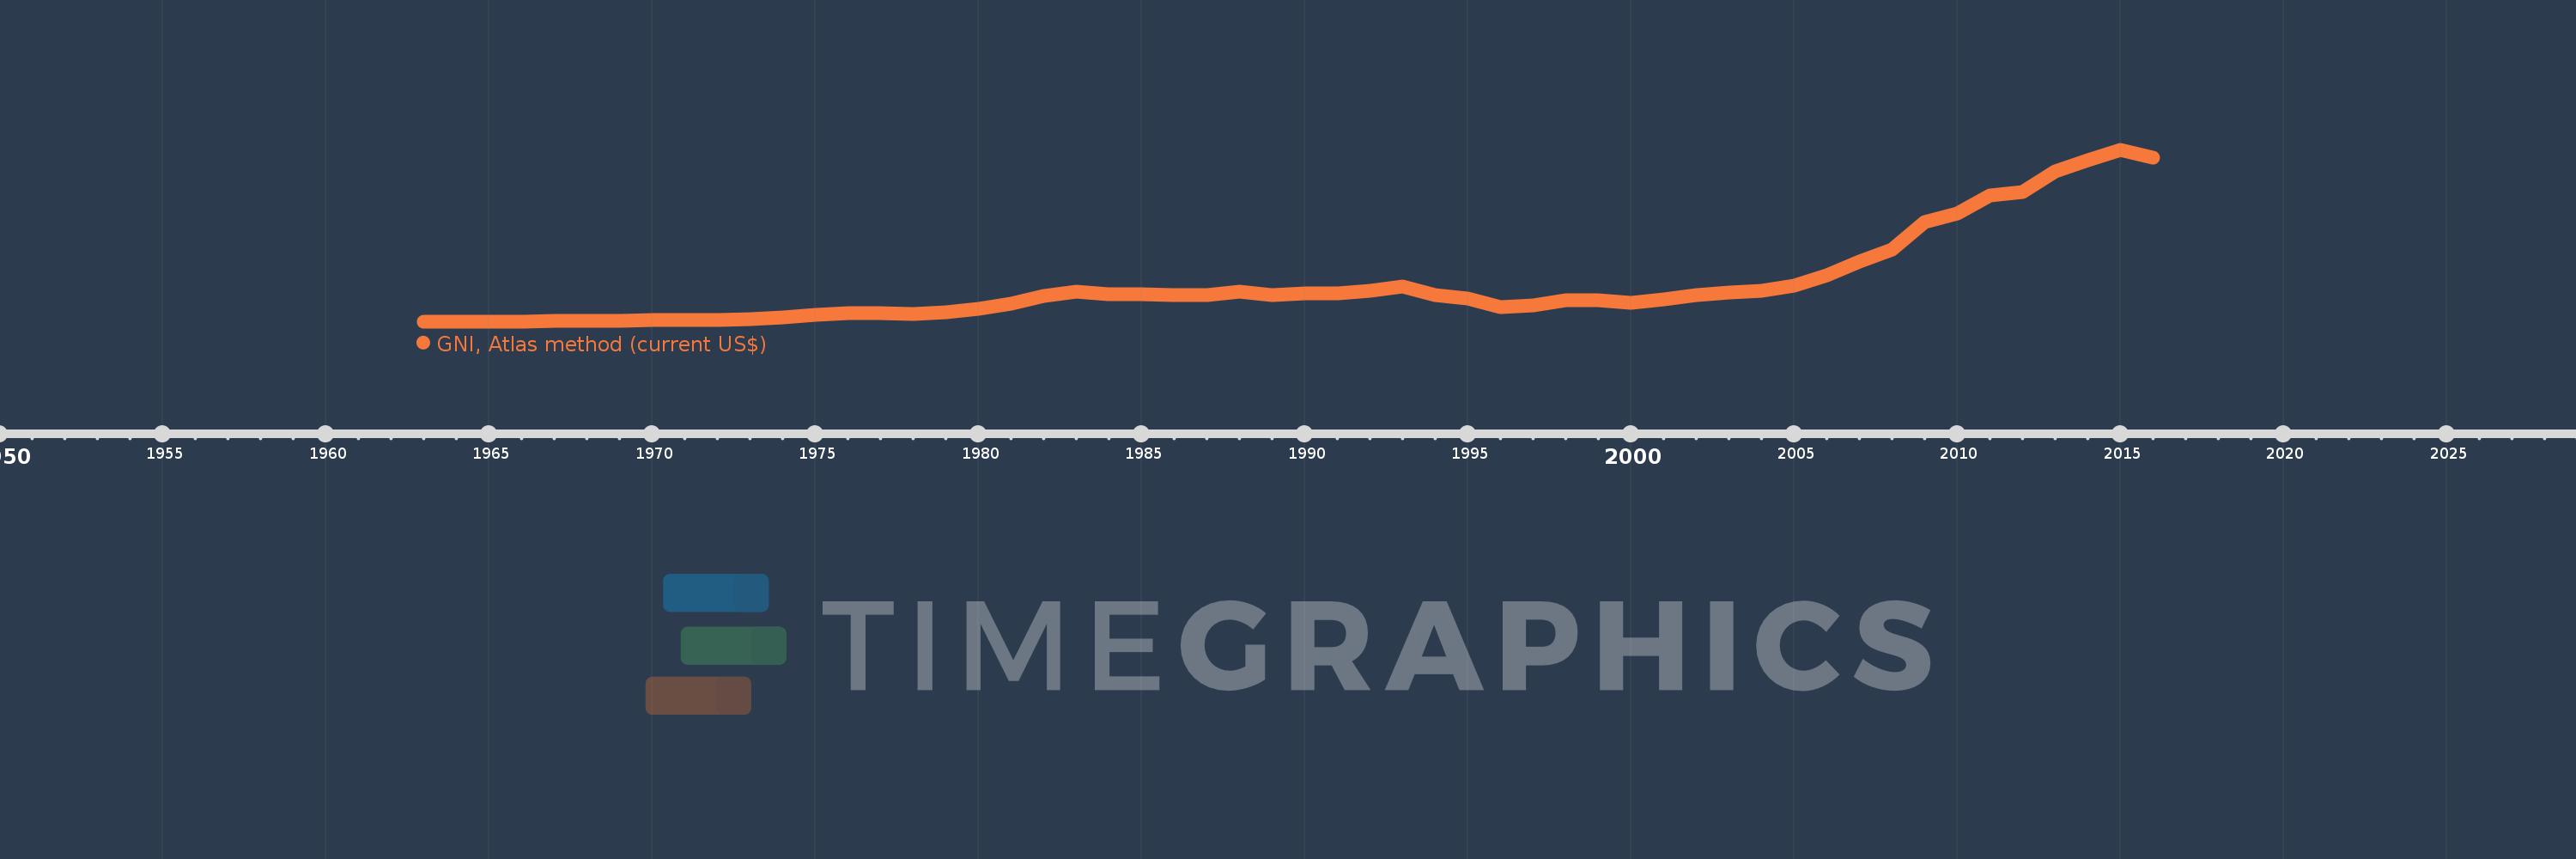
GNI, Atlas method (current US$)
2016,2015,2014,2013,2012,2011,2010,2009,2008,2007,2006,2005,2004,2003,2002,2001,2000,1999,1998,1997,1996,1995,1994,1993,1992,1991,1990,1989,1988,1987,1986,1985,1984,1983,1982,1981,1980,1979,1978,1977,1976,1975,1974,1973,1972,1971,1970,1969,1968,1967,1966,1965,1964,1963
This statistics in other country:
AfghanistanAlbaniaAlgeriaAndorraAngolaAntigua and BarbudaArab WorldArgentinaArmeniaAustraliaAustriaAzerbaijanBahamas, TheBahrainBangladeshBarbadosBelarusBelgiumBelizeBeninBermudaBhutanBoliviaBosnia and HerzegovinaBotswanaBrazilBrunei DarussalamBulgariaBurkina FasoBurundiCabo VerdeCambodiaCameroonCanadaCaribbean small statesCentral African RepublicCentral Europe and the BalticsChadChannel IslandsChileChinaColombiaComorosCongo, Dem. Rep.Congo, Rep.Costa RicaCote d'IvoireCroatiaCubaCyprusCzech RepublicDenmarkDjiboutiDominicaDominican RepublicEarly-demographic dividendEast Asia & PacificEast Asia & Pacific (excluding high income)East Asia & Pacific (IDA & IBRD countries)EcuadorEgypt, Arab Rep.El SalvadorEquatorial GuineaEritreaEstoniaEthiopiaEuro areaEurope & Central AsiaEurope & Central Asia (excluding high income)Europe & Central Asia (IDA & IBRD countries)European UnionFijiFinlandFragile and conflict affected situationsFranceFrench PolynesiaGabonGambia, TheGeorgiaGermanyGhanaGreeceGreenlandGrenadaGuatemalaGuineaGuinea-BissauGuyanaHaitiHeavily indebted poor countries (HIPC)High incomeHondurasHong Kong SAR, ChinaHungaryIBRD onlyIcelandIDA & IBRD totalIDA blendIDA onlyIDA totalIndiaIndonesiaIran, Islamic Rep.IraqIrelandIsle of ManIsraelItalyJamaicaJapanJordanKazakhstanKenyaKiribatiKorea, Rep.KosovoKuwaitKyrgyz RepublicLao PDRLate-demographic dividendLatin America & Caribbean Latin America & Caribbean (excluding high income)Latin America & the Caribbean (IDA & IBRD countries)LatviaLeast developed countries: UN classificationLebanonLesothoLiberiaLibyaLiechtensteinLithuaniaLow & middle incomeLow incomeLower middle incomeLuxembourgMacao SAR, ChinaMacedonia, FYRMadagascarMalawiMalaysiaMaldivesMaliMaltaMarshall IslandsMauritaniaMauritiusMexicoMicronesia, Fed. Sts.Middle East & North AfricaMiddle East & North Africa (excluding high income)Middle East & North Africa (IDA & IBRD countries)Middle incomeMoldovaMonacoMongoliaMontenegroMoroccoMozambiqueMyanmarNamibiaNauruNepalNetherlandsNew CaledoniaNew ZealandNicaraguaNigerNigeriaNorth AmericaNorwayOECD membersOmanOther small statesPacific island small statesPakistanPalauPanamaPapua New GuineaParaguayPeruPhilippinesPolandPortugalPost-demographic dividendPre-demographic dividendPuerto RicoQatarRomaniaRussian FederationRwandaSamoaSan MarinoSao Tome and PrincipeSaudi ArabiaSenegalSerbiaSeychellesSierra LeoneSingaporeSlovak RepublicSloveniaSmall statesSolomon IslandsSouth AfricaSouth AsiaSouth Asia (IDA & IBRD)South SudanSpainSri LankaSt. Kitts and NevisSt. LuciaSt. Vincent and the GrenadinesSub-Saharan Africa Sub-Saharan Africa (excluding high income)Sub-Saharan Africa (IDA & IBRD countries)SudanSurinameSwazilandSwedenSwitzerlandSyrian Arab RepublicTajikistanTanzaniaThailandTimor-LesteTogoTongaTrinidad and TobagoTunisiaTurkeyTurkmenistanTuvaluUgandaUkraineUnited Arab EmiratesUnited KingdomUnited StatesUpper middle incomeUruguayUzbekistanVanuatuVenezuela, RBVietnamVirgin Islands (U.S.)West Bank and GazaWorldYemen, Rep.ZambiaZimbabwe Timeline:
This timeline shows a graph from 1963 to 2016 of Congo, Rep.. No data until 1962. Number of actual observations by date: 54.
Source name:
World Development Indicators
Source organization:
World Bank national accounts data, and OECD National Accounts data files.
Categories, topics:
Economy & Growth
Last updated:
apr 23, 2017
Indicators value changes by year
Minimum:
158.327 mln
jan 1, 1963
Maximum:
12.256 bln
jan 1, 2015
At the date of observation
Value
Absolute change
Change from previous value
jan 1, 1963
158.327 mln
+158.327 mln
0.0%
jan 1, 1964
161.151 mln
+2.824 mln
1.78%
jan 1, 1965
176.083 mln
+14.932 mln
9.27%
jan 1, 1966
192.891 mln
+16.808 mln
9.55%
jan 1, 1967
207.878 mln
+14.987 mln
7.77%
jan 1, 1968
226.84 mln
+18.962 mln
9.12%
jan 1, 1969
256.651 mln
+29.811 mln
13.14%
jan 1, 1970
277.637 mln
+20.985 mln
8.18%
jan 1, 1971
288.177 mln
+10.54 mln
3.8%
jan 1, 1972
317.34 mln
+29.163 mln
10.12%
jan 1, 1973
379.963 mln
+62.623 mln
19.73%
jan 1, 1974
491.412 mln
+111.449 mln
29.33%
jan 1, 1975
631.361 mln
+139.949 mln
28.48%
jan 1, 1976
770.488 mln
+139.127 mln
22.04%
jan 1, 1977
762.704 mln
-7.785 mln
-1.01%
jan 1, 1978
733.541 mln
-29.162 mln
-3.82%
jan 1, 1979
822.173 mln
+88.632 mln
12.08%
jan 1, 1980
1.057 bln
+234.758 mln
28.55%
jan 1, 1981
1.471 bln
+414.142 mln
39.18%
jan 1, 1982
1.995 bln
+523.579 mln
35.59%
jan 1, 1983
2.305 bln
+310.626 mln
15.57%
jan 1, 1984
2.094 bln
-211.452 mln
-9.17%
jan 1, 1985
2.124 bln
+30.057 mln
1.44%
jan 1, 1986
2.036 bln
-87.813 mln
-4.13%
jan 1, 1987
2.068 bln
+31.551 mln
1.55%
jan 1, 1988
2.286 bln
+217.88 mln
10.54%
jan 1, 1989
2.076 bln
-209.257 mln
-9.16%
jan 1, 1990
2.164 bln
+88.254 mln
4.25%
jan 1, 1991
2.184 bln
+19.936 mln
0.92%
jan 1, 1992
2.336 bln
+152.007 mln
6.96%
jan 1, 1993
2.642 bln
+305.974 mln
13.1%
jan 1, 1994
2.041 bln
-600.968 mln
-22.74%
jan 1, 1995
1.789 bln
-252.025 mln
-12.35%
jan 1, 1996
1.175 bln
-614.279 mln
-34.33%
jan 1, 1997
1.301 bln
+126.115 mln
10.73%
jan 1, 1998
1.691 bln
+389.525 mln
29.93%
jan 1, 1999
1.706 bln
+14.969 mln
0.89%
jan 1, 2000
1.497 bln
-209.203 mln
-12.26%
jan 1, 2001
1.767 bln
+270.177 mln
18.05%
jan 1, 2002
2.027 bln
+260.51 mln
14.75%
jan 1, 2003
2.225 bln
+197.954 mln
9.76%
jan 1, 2004
2.363 bln
+138.245 mln
6.21%
jan 1, 2005
2.689 bln
+325.682 mln
13.78%
jan 1, 2006
3.45 bln
+760.6 mln
28.28%
jan 1, 2007
4.416 bln
+966.419 mln
28.01%
jan 1, 2008
5.241 bln
+825.051 mln
18.68%
jan 1, 2009
7.177 bln
+1.936 bln
36.94%
jan 1, 2010
7.806 bln
+629.164 mln
8.77%
jan 1, 2011
9.071 bln
+1.265 bln
16.21%
jan 1, 2012
9.316 bln
+244.255 mln
2.69%
jan 1, 2013
10.774 bln
+1.458 bln
15.65%
jan 1, 2014
11.528 bln
+754.218 mln
7.0%
jan 1, 2015
12.256 bln
+727.857 mln
6.31%
jan 1, 2016
11.723 bln
-532.323 mln
-4.34%
Ranking of countries by current statistics by years


Comments: