29
/
en
AIzaSyAYiBZKx7MnpbEhh9jyipgxe19OcubqV5w
April 1, 2024
254154
Suriname
SUR
true
2
1
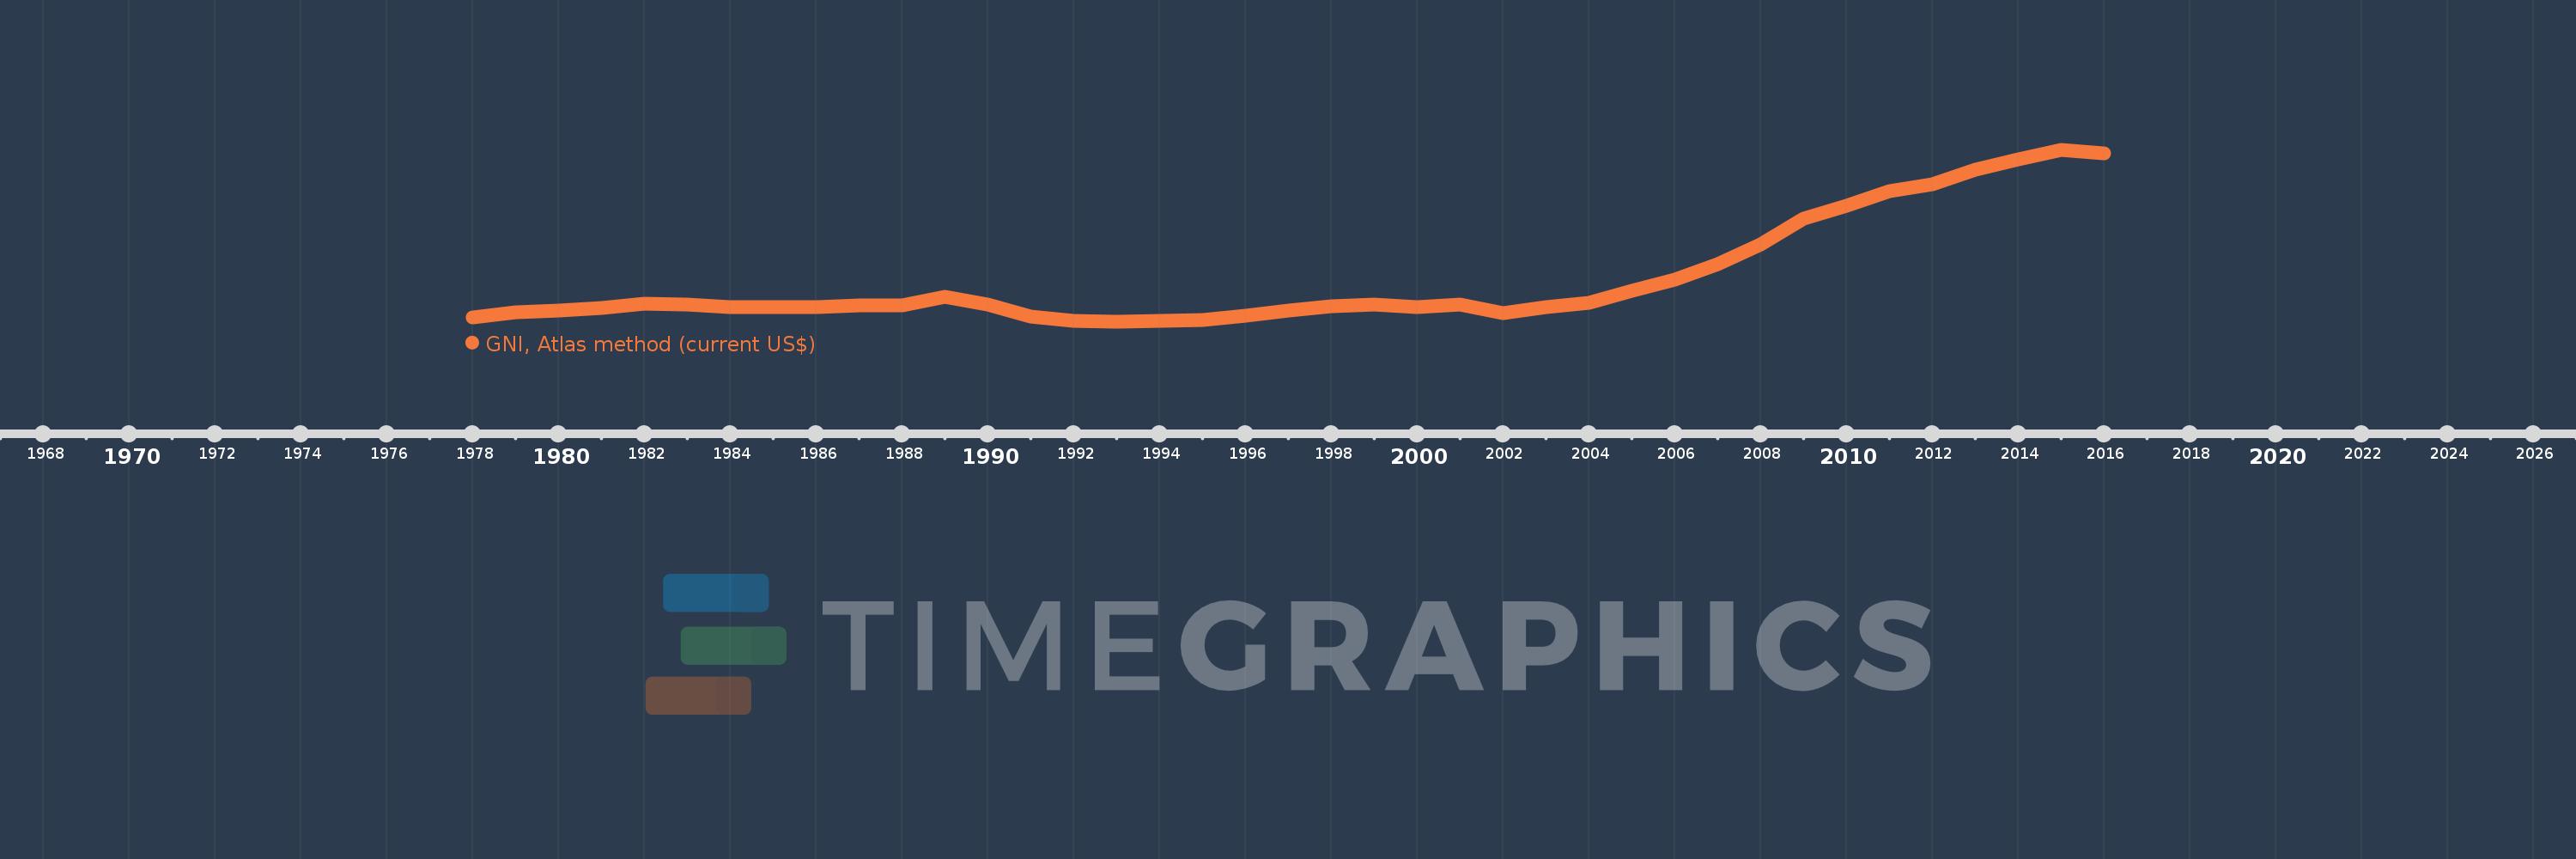
GNI, Atlas method (current US$)
2016,2015,2014,2013,2012,2011,2010,2009,2008,2007,2006,2005,2004,2003,2002,2001,2000,1999,1998,1997,1996,1995,1993,1992,1991,1990,1989,1988,1987,1986,1985,1984,1983,1982,1981,1980,1979,1978
This statistics in other country:
AfghanistanAlbaniaAlgeriaAndorraAngolaAntigua and BarbudaArab WorldArgentinaArmeniaAustraliaAustriaAzerbaijanBahamas, TheBahrainBangladeshBarbadosBelarusBelgiumBelizeBeninBermudaBhutanBoliviaBosnia and HerzegovinaBotswanaBrazilBrunei DarussalamBulgariaBurkina FasoBurundiCabo VerdeCambodiaCameroonCanadaCaribbean small statesCentral African RepublicCentral Europe and the BalticsChadChannel IslandsChileChinaColombiaComorosCongo, Dem. Rep.Congo, Rep.Costa RicaCote d'IvoireCroatiaCubaCyprusCzech RepublicDenmarkDjiboutiDominicaDominican RepublicEarly-demographic dividendEast Asia & PacificEast Asia & Pacific (excluding high income)East Asia & Pacific (IDA & IBRD countries)EcuadorEgypt, Arab Rep.El SalvadorEquatorial GuineaEritreaEstoniaEthiopiaEuro areaEurope & Central AsiaEurope & Central Asia (excluding high income)Europe & Central Asia (IDA & IBRD countries)European UnionFijiFinlandFragile and conflict affected situationsFranceFrench PolynesiaGabonGambia, TheGeorgiaGermanyGhanaGreeceGreenlandGrenadaGuatemalaGuineaGuinea-BissauGuyanaHaitiHeavily indebted poor countries (HIPC)High incomeHondurasHong Kong SAR, ChinaHungaryIBRD onlyIcelandIDA & IBRD totalIDA blendIDA onlyIDA totalIndiaIndonesiaIran, Islamic Rep.IraqIrelandIsle of ManIsraelItalyJamaicaJapanJordanKazakhstanKenyaKiribatiKorea, Rep.KosovoKuwaitKyrgyz RepublicLao PDRLate-demographic dividendLatin America & Caribbean Latin America & Caribbean (excluding high income)Latin America & the Caribbean (IDA & IBRD countries)LatviaLeast developed countries: UN classificationLebanonLesothoLiberiaLibyaLiechtensteinLithuaniaLow & middle incomeLow incomeLower middle incomeLuxembourgMacao SAR, ChinaMacedonia, FYRMadagascarMalawiMalaysiaMaldivesMaliMaltaMarshall IslandsMauritaniaMauritiusMexicoMicronesia, Fed. Sts.Middle East & North AfricaMiddle East & North Africa (excluding high income)Middle East & North Africa (IDA & IBRD countries)Middle incomeMoldovaMonacoMongoliaMontenegroMoroccoMozambiqueMyanmarNamibiaNauruNepalNetherlandsNew CaledoniaNew ZealandNicaraguaNigerNigeriaNorth AmericaNorwayOECD membersOmanOther small statesPacific island small statesPakistanPalauPanamaPapua New GuineaParaguayPeruPhilippinesPolandPortugalPost-demographic dividendPre-demographic dividendPuerto RicoQatarRomaniaRussian FederationRwandaSamoaSan MarinoSao Tome and PrincipeSaudi ArabiaSenegalSerbiaSeychellesSierra LeoneSingaporeSlovak RepublicSloveniaSmall statesSolomon IslandsSouth AfricaSouth AsiaSouth Asia (IDA & IBRD)South SudanSpainSri LankaSt. Kitts and NevisSt. LuciaSt. Vincent and the GrenadinesSub-Saharan Africa Sub-Saharan Africa (excluding high income)Sub-Saharan Africa (IDA & IBRD countries)SudanSurinameSwazilandSwedenSwitzerlandSyrian Arab RepublicTajikistanTanzaniaThailandTimor-LesteTogoTongaTrinidad and TobagoTunisiaTurkeyTurkmenistanTuvaluUgandaUkraineUnited Arab EmiratesUnited KingdomUnited StatesUpper middle incomeUruguayUzbekistanVanuatuVenezuela, RBVietnamVirgin Islands (U.S.)West Bank and GazaWorldYemen, Rep.ZambiaZimbabwe Timeline:
This timeline shows a graph from 1978 to 2016 of Suriname. No data until 1977. Number of actual observations by date: 38.
Source name:
World Development Indicators
Source organization:
World Bank national accounts data, and OECD National Accounts data files.
Categories, topics:
Economy & Growth
Last updated:
apr 23, 2017
Indicators value changes by year
Minimum:
428.361 mln
jan 1, 1993
Maximum:
5.161 bln
jan 1, 2015
At the date of observation
Value
Absolute change
Change from previous value
jan 1, 1978
564.169 mln
+564.169 mln
0.0%
jan 1, 1979
694.253 mln
+130.084 mln
23.06%
jan 1, 1980
753.21 mln
+58.957 mln
8.49%
jan 1, 1981
825.61 mln
+72.399 mln
9.61%
jan 1, 1982
920.774 mln
+95.165 mln
11.53%
jan 1, 1983
901.093 mln
-19.681 mln
-2.14%
jan 1, 1984
849.296 mln
-51.797 mln
-5.75%
jan 1, 1985
842.765 mln
-6.531 mln
-0.77%
jan 1, 1986
847.585 mln
+4.821 mln
0.57%
jan 1, 1987
881.126 mln
+33.541 mln
3.96%
jan 1, 1988
890.735 mln
+9.609 mln
1.09%
jan 1, 1989
1.131 bln
+240.68 mln
27.02%
jan 1, 1990
907.115 mln
-224.3 mln
-19.82%
jan 1, 1991
582.967 mln
-324.148 mln
-35.73%
jan 1, 1992
464.618 mln
-118.349 mln
-20.3%
jan 1, 1993
428.361 mln
-36.256 mln
-7.8%
jan 1, 1995
475.204 mln
+46.842 mln
10.94%
jan 1, 1996
590.065 mln
+114.862 mln
24.17%
jan 1, 1997
742.68 mln
+152.615 mln
25.86%
jan 1, 1998
854.338 mln
+111.658 mln
15.03%
jan 1, 1999
909.725 mln
+55.387 mln
6.48%
jan 1, 2000
847.14 mln
-62.585 mln
-6.88%
jan 1, 2001
898.922 mln
+51.783 mln
6.11%
jan 1, 2002
665.641 mln
-233.281 mln
-25.95%
jan 1, 2003
835.341 mln
+169.7 mln
25.49%
jan 1, 2004
967.534 mln
+132.193 mln
15.83%
jan 1, 2005
1.284 bln
+316.137 mln
32.67%
jan 1, 2006
1.595 bln
+311.808 mln
24.29%
jan 1, 2007
2.012 bln
+416.324 mln
26.09%
jan 1, 2008
2.562 bln
+549.858 mln
27.33%
jan 1, 2009
3.272 bln
+710.161 mln
27.72%
jan 1, 2010
3.642 bln
+370.002 mln
11.31%
jan 1, 2011
4.032 bln
+389.874 mln
10.71%
jan 1, 2012
4.225 bln
+192.997 mln
4.79%
jan 1, 2013
4.629 bln
+404.697 mln
9.58%
jan 1, 2014
4.897 bln
+267.255 mln
5.77%
jan 1, 2015
5.161 bln
+264.753 mln
5.41%
jan 1, 2016
5.084 bln
-77.143 mln
-1.49%
Ranking of countries by current statistics by years


Comments: