29
/
en
AIzaSyAYiBZKx7MnpbEhh9jyipgxe19OcubqV5w
April 1, 2024
93595
Bulgaria
BGR
true
2
1
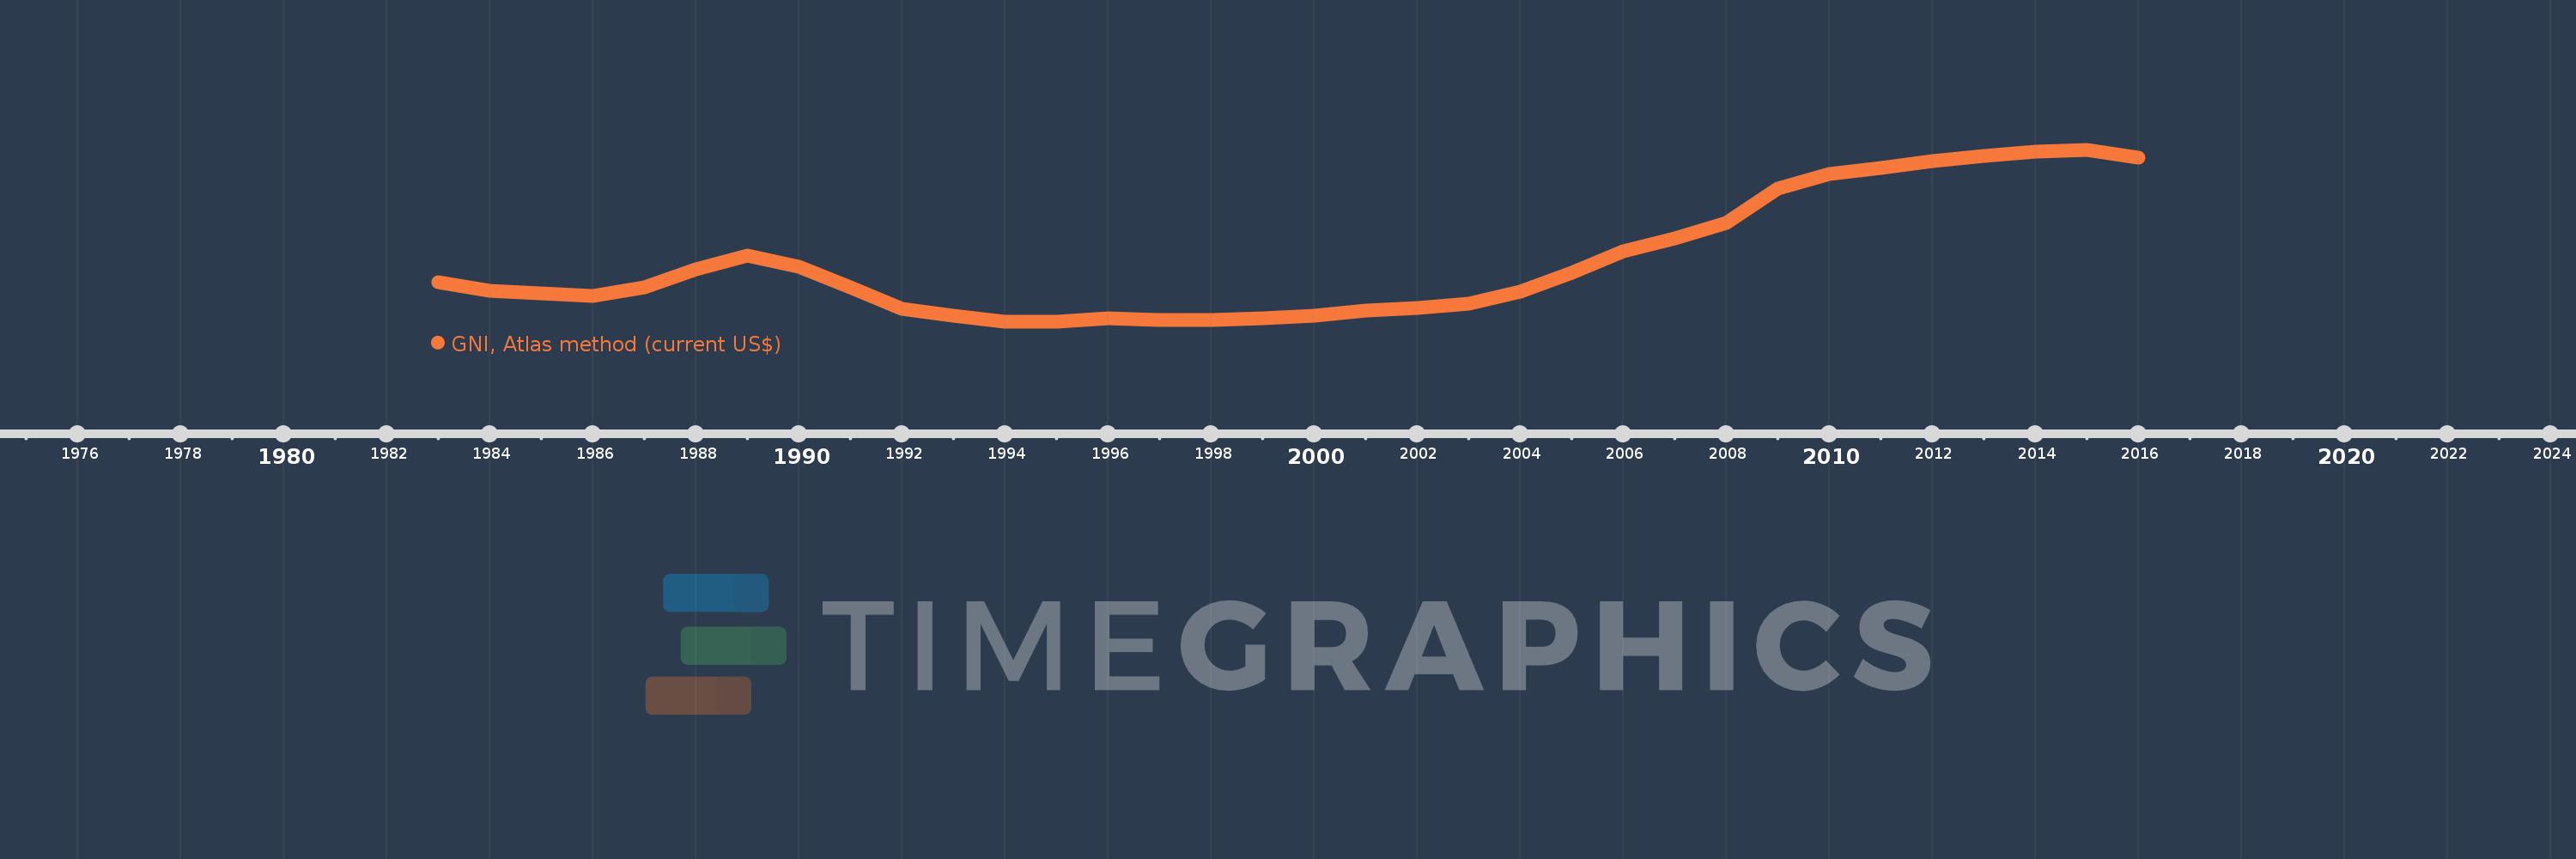
GNI, Atlas method (current US$)
2016,2015,2014,2013,2012,2011,2010,2009,2008,2007,2006,2005,2004,2003,2002,2001,2000,1999,1998,1997,1996,1995,1994,1993,1992,1991,1990,1989,1988,1987,1986,1985,1984,1983
This statistics in other country:
AfghanistanAlbaniaAlgeriaAndorraAngolaAntigua and BarbudaArab WorldArgentinaArmeniaAustraliaAustriaAzerbaijanBahamas, TheBahrainBangladeshBarbadosBelarusBelgiumBelizeBeninBermudaBhutanBoliviaBosnia and HerzegovinaBotswanaBrazilBrunei DarussalamBulgariaBurkina FasoBurundiCabo VerdeCambodiaCameroonCanadaCaribbean small statesCentral African RepublicCentral Europe and the BalticsChadChannel IslandsChileChinaColombiaComorosCongo, Dem. Rep.Congo, Rep.Costa RicaCote d'IvoireCroatiaCubaCyprusCzech RepublicDenmarkDjiboutiDominicaDominican RepublicEarly-demographic dividendEast Asia & PacificEast Asia & Pacific (excluding high income)East Asia & Pacific (IDA & IBRD countries)EcuadorEgypt, Arab Rep.El SalvadorEquatorial GuineaEritreaEstoniaEthiopiaEuro areaEurope & Central AsiaEurope & Central Asia (excluding high income)Europe & Central Asia (IDA & IBRD countries)European UnionFijiFinlandFragile and conflict affected situationsFranceFrench PolynesiaGabonGambia, TheGeorgiaGermanyGhanaGreeceGreenlandGrenadaGuatemalaGuineaGuinea-BissauGuyanaHaitiHeavily indebted poor countries (HIPC)High incomeHondurasHong Kong SAR, ChinaHungaryIBRD onlyIcelandIDA & IBRD totalIDA blendIDA onlyIDA totalIndiaIndonesiaIran, Islamic Rep.IraqIrelandIsle of ManIsraelItalyJamaicaJapanJordanKazakhstanKenyaKiribatiKorea, Rep.KosovoKuwaitKyrgyz RepublicLao PDRLate-demographic dividendLatin America & Caribbean Latin America & Caribbean (excluding high income)Latin America & the Caribbean (IDA & IBRD countries)LatviaLeast developed countries: UN classificationLebanonLesothoLiberiaLibyaLiechtensteinLithuaniaLow & middle incomeLow incomeLower middle incomeLuxembourgMacao SAR, ChinaMacedonia, FYRMadagascarMalawiMalaysiaMaldivesMaliMaltaMarshall IslandsMauritaniaMauritiusMexicoMicronesia, Fed. Sts.Middle East & North AfricaMiddle East & North Africa (excluding high income)Middle East & North Africa (IDA & IBRD countries)Middle incomeMoldovaMonacoMongoliaMontenegroMoroccoMozambiqueMyanmarNamibiaNauruNepalNetherlandsNew CaledoniaNew ZealandNicaraguaNigerNigeriaNorth AmericaNorwayOECD membersOmanOther small statesPacific island small statesPakistanPalauPanamaPapua New GuineaParaguayPeruPhilippinesPolandPortugalPost-demographic dividendPre-demographic dividendPuerto RicoQatarRomaniaRussian FederationRwandaSamoaSan MarinoSao Tome and PrincipeSaudi ArabiaSenegalSerbiaSeychellesSierra LeoneSingaporeSlovak RepublicSloveniaSmall statesSolomon IslandsSouth AfricaSouth AsiaSouth Asia (IDA & IBRD)South SudanSpainSri LankaSt. Kitts and NevisSt. LuciaSt. Vincent and the GrenadinesSub-Saharan Africa Sub-Saharan Africa (excluding high income)Sub-Saharan Africa (IDA & IBRD countries)SudanSurinameSwazilandSwedenSwitzerlandSyrian Arab RepublicTajikistanTanzaniaThailandTimor-LesteTogoTongaTrinidad and TobagoTunisiaTurkeyTurkmenistanTuvaluUgandaUkraineUnited Arab EmiratesUnited KingdomUnited StatesUpper middle incomeUruguayUzbekistanVanuatuVenezuela, RBVietnamVirgin Islands (U.S.)West Bank and GazaWorldYemen, Rep.ZambiaZimbabwe Timeline:
This timeline shows a graph from 1983 to 2016 of Bulgaria. No data until 1982. Number of actual observations by date: 34.
Source name:
World Development Indicators
Source organization:
World Bank national accounts data, and OECD National Accounts data files.
Categories, topics:
Economy & Growth
Last updated:
apr 23, 2017
Indicators value changes by year
Minimum:
10.5 bln
jan 1, 1995
Maximum:
55.763 bln
jan 1, 2015
At the date of observation
Value
Absolute change
Change from previous value
jan 1, 1983
21.03 bln
+21.03 bln
0.0%
jan 1, 1984
18.68 bln
-2.35 bln
-11.17%
jan 1, 1985
18.028 bln
-651.809 mln
-3.49%
jan 1, 1986
17.467 bln
-561.369 mln
-3.11%
jan 1, 1987
19.589 bln
+2.122 bln
12.15%
jan 1, 1988
24.404 bln
+4.815 bln
24.58%
jan 1, 1989
27.89 bln
+3.486 bln
14.28%
jan 1, 1990
25.143 bln
-2.747 bln
-9.85%
jan 1, 1991
19.583 bln
-5.56 bln
-22.11%
jan 1, 1992
14.006 bln
-5.578 bln
-28.48%
jan 1, 1993
12.201 bln
-1.805 bln
-12.89%
jan 1, 1994
10.582 bln
-1.619 bln
-13.27%
jan 1, 1995
10.5 bln
-82.058 mln
-0.78%
jan 1, 1996
11.428 bln
+928.24 mln
8.84%
jan 1, 1997
10.91 bln
-518.785 mln
-4.54%
jan 1, 1998
11.036 bln
+126.116 mln
1.16%
jan 1, 1999
11.455 bln
+419.424 mln
3.8%
jan 1, 2000
12.199 bln
+744.315 mln
6.5%
jan 1, 2001
13.531 bln
+1.331 bln
10.91%
jan 1, 2002
14.153 bln
+622.204 mln
4.6%
jan 1, 2003
15.388 bln
+1.236 bln
8.73%
jan 1, 2004
18.378 bln
+2.989 bln
19.43%
jan 1, 2005
23.526 bln
+5.148 bln
28.01%
jan 1, 2006
29.094 bln
+5.569 bln
23.67%
jan 1, 2007
32.597 bln
+3.503 bln
12.04%
jan 1, 2008
36.662 bln
+4.065 bln
12.47%
jan 1, 2009
45.709 bln
+9.047 bln
24.68%
jan 1, 2010
49.449 bln
+3.74 bln
8.18%
jan 1, 2011
51.12 bln
+1.671 bln
3.38%
jan 1, 2012
52.822 bln
+1.702 bln
3.33%
jan 1, 2013
54.187 bln
+1.365 bln
2.58%
jan 1, 2014
55.318 bln
+1.132 bln
2.09%
jan 1, 2015
55.763 bln
+445.015 mln
0.8%
jan 1, 2016
53.694 bln
-2.069 bln
-3.71%
Ranking of countries by current statistics by years


Comments: