29
/
en
AIzaSyAYiBZKx7MnpbEhh9jyipgxe19OcubqV5w
April 1, 2024
31608
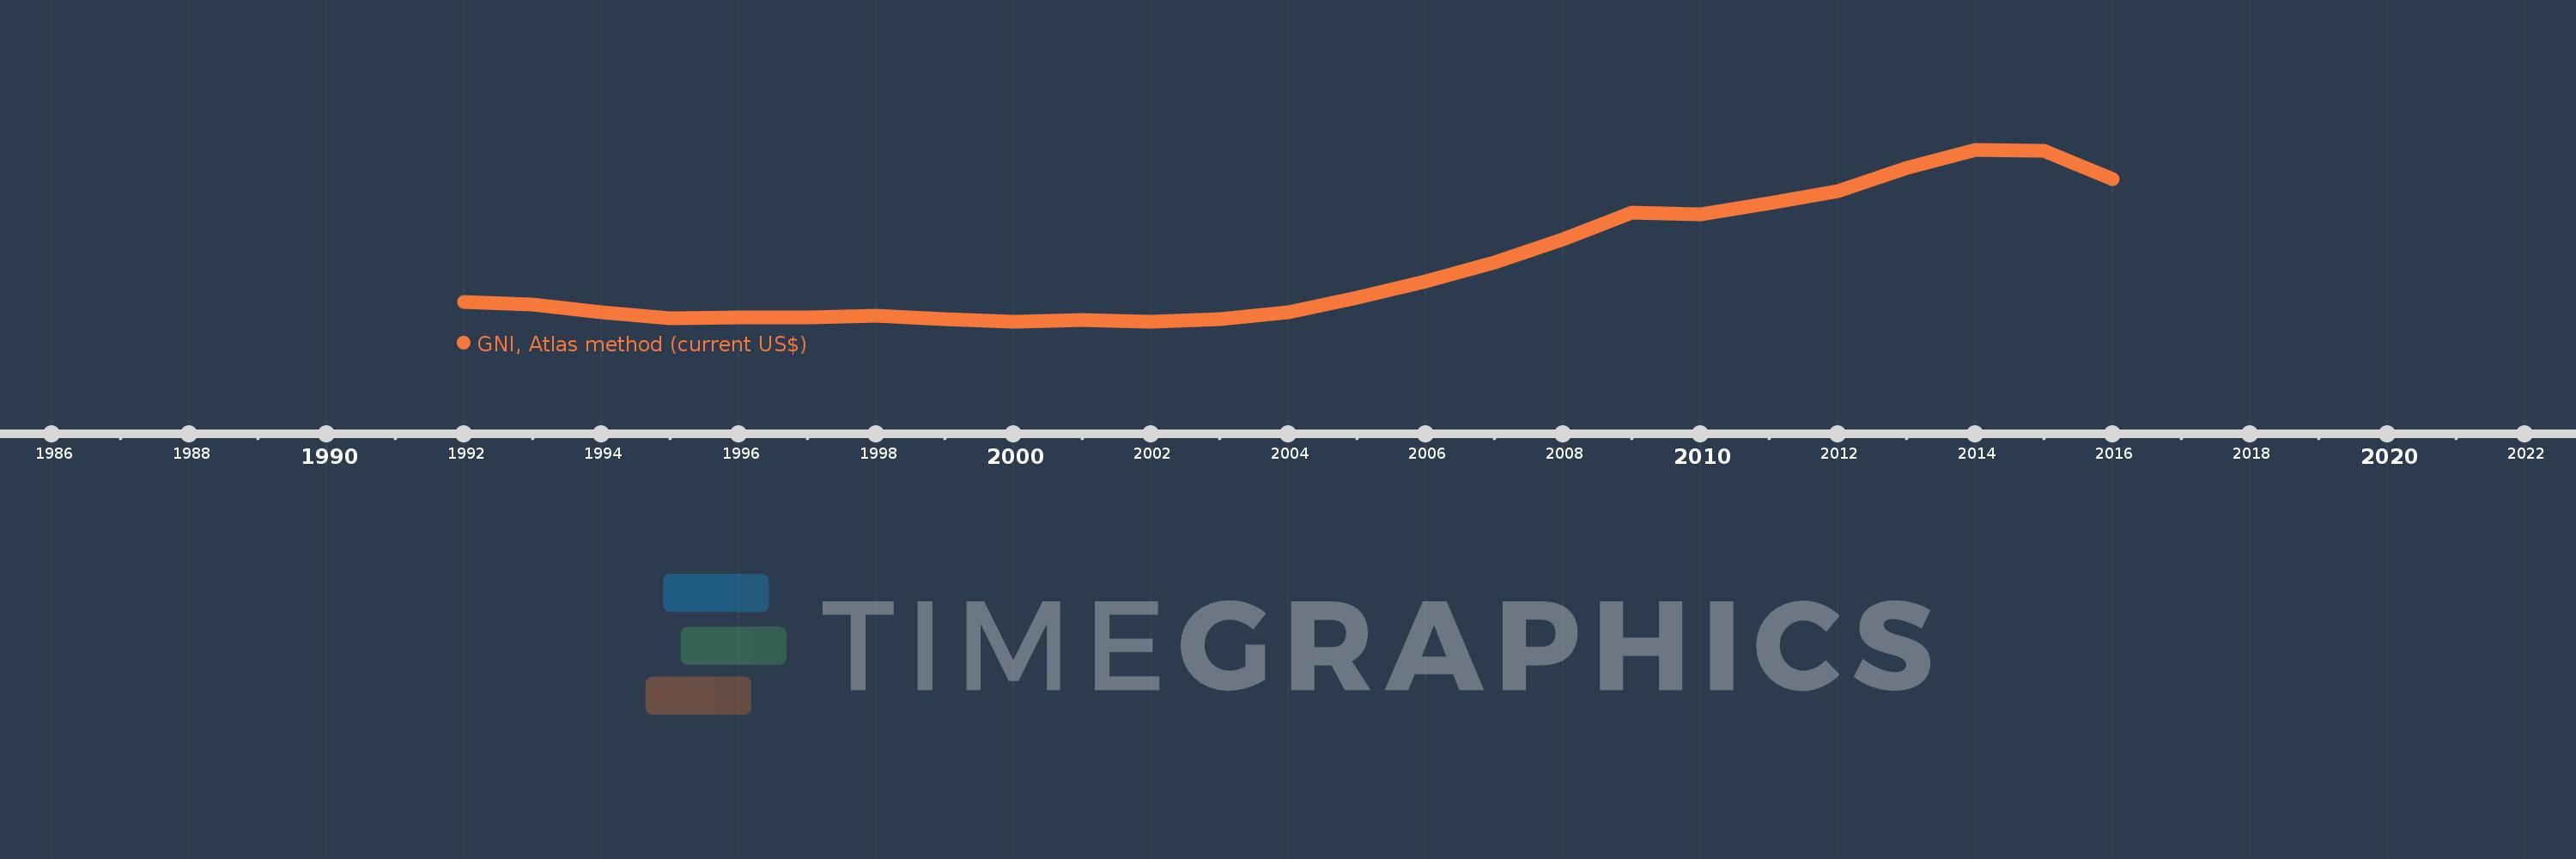
Europe & Central Asia (excluding high income)
ECA
false
2
1
GNI, Atlas method (current US$)
2016,2015,2014,2013,2012,2011,2010,2009,2008,2007,2006,2005,2004,2003,2002,2001,2000,1999,1998,1997,1996,1995,1994,1993,1992
This statistics in other country:
AfghanistanAlbaniaAlgeriaAndorraAngolaAntigua and BarbudaArab WorldArgentinaArmeniaAustraliaAustriaAzerbaijanBahamas, TheBahrainBangladeshBarbadosBelarusBelgiumBelizeBeninBermudaBhutanBoliviaBosnia and HerzegovinaBotswanaBrazilBrunei DarussalamBulgariaBurkina FasoBurundiCabo VerdeCambodiaCameroonCanadaCaribbean small statesCentral African RepublicCentral Europe and the BalticsChadChannel IslandsChileChinaColombiaComorosCongo, Dem. Rep.Congo, Rep.Costa RicaCote d'IvoireCroatiaCubaCyprusCzech RepublicDenmarkDjiboutiDominicaDominican RepublicEarly-demographic dividendEast Asia & PacificEast Asia & Pacific (excluding high income)East Asia & Pacific (IDA & IBRD countries)EcuadorEgypt, Arab Rep.El SalvadorEquatorial GuineaEritreaEstoniaEthiopiaEuro areaEurope & Central AsiaEurope & Central Asia (excluding high income)Europe & Central Asia (IDA & IBRD countries)European UnionFijiFinlandFragile and conflict affected situationsFranceFrench PolynesiaGabonGambia, TheGeorgiaGermanyGhanaGreeceGreenlandGrenadaGuatemalaGuineaGuinea-BissauGuyanaHaitiHeavily indebted poor countries (HIPC)High incomeHondurasHong Kong SAR, ChinaHungaryIBRD onlyIcelandIDA & IBRD totalIDA blendIDA onlyIDA totalIndiaIndonesiaIran, Islamic Rep.IraqIrelandIsle of ManIsraelItalyJamaicaJapanJordanKazakhstanKenyaKiribatiKorea, Rep.KosovoKuwaitKyrgyz RepublicLao PDRLate-demographic dividendLatin America & Caribbean Latin America & Caribbean (excluding high income)Latin America & the Caribbean (IDA & IBRD countries)LatviaLeast developed countries: UN classificationLebanonLesothoLiberiaLibyaLiechtensteinLithuaniaLow & middle incomeLow incomeLower middle incomeLuxembourgMacao SAR, ChinaMacedonia, FYRMadagascarMalawiMalaysiaMaldivesMaliMaltaMarshall IslandsMauritaniaMauritiusMexicoMicronesia, Fed. Sts.Middle East & North AfricaMiddle East & North Africa (excluding high income)Middle East & North Africa (IDA & IBRD countries)Middle incomeMoldovaMonacoMongoliaMontenegroMoroccoMozambiqueMyanmarNamibiaNauruNepalNetherlandsNew CaledoniaNew ZealandNicaraguaNigerNigeriaNorth AmericaNorwayOECD membersOmanOther small statesPacific island small statesPakistanPalauPanamaPapua New GuineaParaguayPeruPhilippinesPolandPortugalPost-demographic dividendPre-demographic dividendPuerto RicoQatarRomaniaRussian FederationRwandaSamoaSan MarinoSao Tome and PrincipeSaudi ArabiaSenegalSerbiaSeychellesSierra LeoneSingaporeSlovak RepublicSloveniaSmall statesSolomon IslandsSouth AfricaSouth AsiaSouth Asia (IDA & IBRD)South SudanSpainSri LankaSt. Kitts and NevisSt. LuciaSt. Vincent and the GrenadinesSub-Saharan Africa Sub-Saharan Africa (excluding high income)Sub-Saharan Africa (IDA & IBRD countries)SudanSurinameSwazilandSwedenSwitzerlandSyrian Arab RepublicTajikistanTanzaniaThailandTimor-LesteTogoTongaTrinidad and TobagoTunisiaTurkeyTurkmenistanTuvaluUgandaUkraineUnited Arab EmiratesUnited KingdomUnited StatesUpper middle incomeUruguayUzbekistanVanuatuVenezuela, RBVietnamVirgin Islands (U.S.)West Bank and GazaWorldYemen, Rep.ZambiaZimbabwe Timeline:
This timeline shows a graph from 1992 to 2016 of Europe & Central Asia (excluding high income). No data until 1991. Number of actual observations by date: 25.
Source name:
World Development Indicators
Source organization:
World Bank national accounts data, and OECD National Accounts data files.
Categories, topics:
Economy & Growth
Last updated:
apr 23, 2017
Indicators value changes by year
Minimum:
663.047 bln
jan 1, 2002
Maximum:
3.943 trl
jan 1, 2014
At the date of observation
Value
Absolute change
Change from previous value
jan 1, 1992
1.047 trl
+1.047 trl
0.0%
jan 1, 1993
995.72 bln
-51.43 bln
-4.91%
jan 1, 1994
846.963 bln
-148.757 bln
-14.94%
jan 1, 1995
732.045 bln
-114.918 bln
-13.57%
jan 1, 1996
745.301 bln
+13.256 bln
1.81%
jan 1, 1997
750.186 bln
+4.884 bln
0.66%
jan 1, 1998
778.801 bln
+28.615 bln
3.81%
jan 1, 1999
717.024 bln
-61.777 bln
-7.93%
jan 1, 2000
663.173 bln
-53.851 bln
-7.51%
jan 1, 2001
693.943 bln
+30.771 bln
4.64%
jan 1, 2002
663.047 bln
-30.896 bln
-4.45%
jan 1, 2003
723.387 bln
+60.34 bln
9.1%
jan 1, 2004
855.388 bln
+132.001 bln
18.25%
jan 1, 2005
1.123 trl
+267.317 bln
31.25%
jan 1, 2006
1.446 trl
+323.693 bln
28.83%
jan 1, 2007
1.797 trl
+351.02 bln
24.27%
jan 1, 2008
2.239 trl
+441.793 bln
24.58%
jan 1, 2009
2.746 trl
+507.261 bln
22.65%
jan 1, 2010
2.715 trl
-31.247 bln
-1.14%
jan 1, 2011
2.927 trl
+211.767 bln
7.8%
jan 1, 2012
3.168 trl
+240.803 bln
8.23%
jan 1, 2013
3.603 trl
+434.865 bln
13.73%
jan 1, 2014
3.943 trl
+339.909 bln
9.43%
jan 1, 2015
3.928 trl
-14.506 bln
-0.37%
jan 1, 2016
3.39 trl
-537.601 bln
-13.69%
Ranking of countries by current statistics by years


Comments: