29
/
en
AIzaSyAYiBZKx7MnpbEhh9jyipgxe19OcubqV5w
April 1, 2024
108543
Comoros
COM
true
2
1
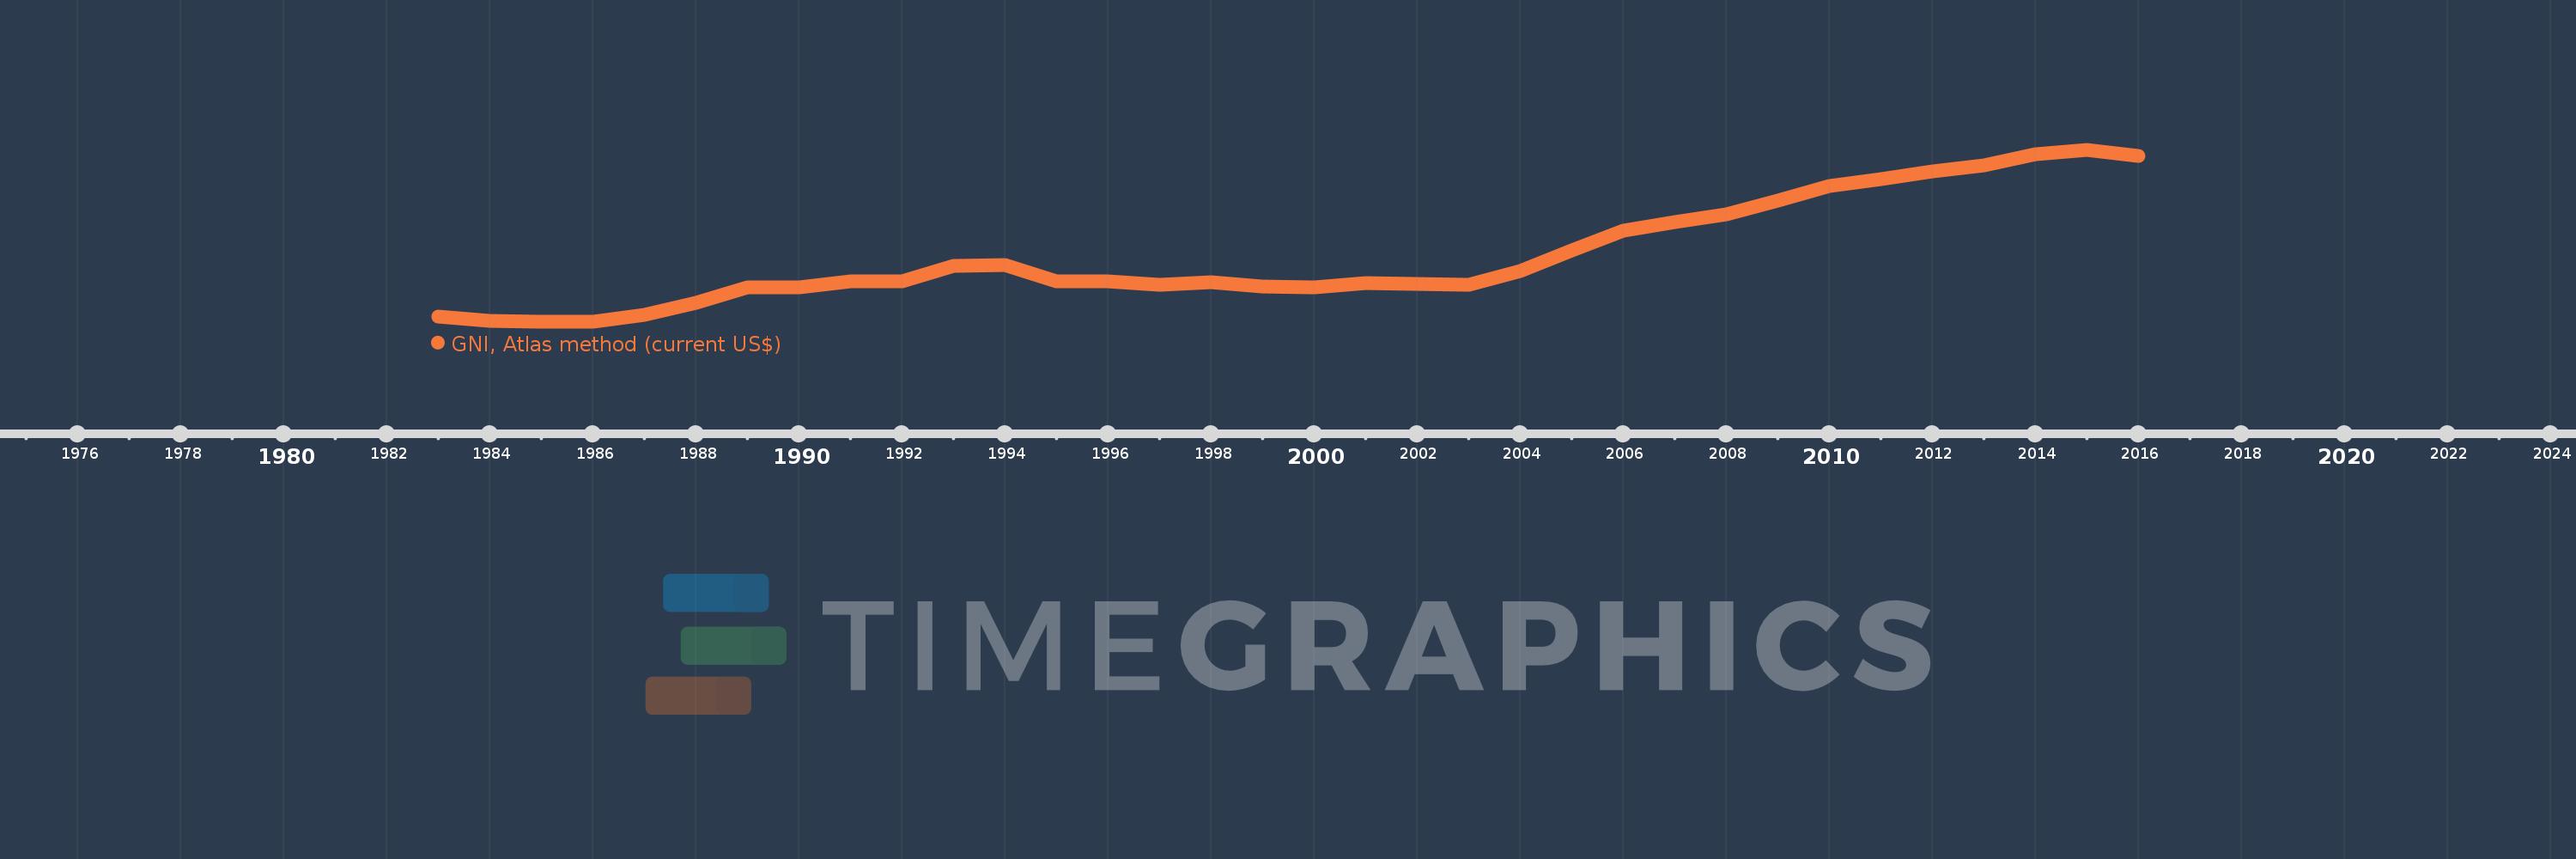
GNI, Atlas method (current US$)
2016,2015,2014,2013,2012,2011,2010,2009,2008,2007,2006,2005,2004,2003,2002,2001,2000,1999,1998,1997,1996,1995,1994,1993,1992,1991,1990,1989,1988,1987,1986,1985,1984,1983
This statistics in other country:
AfghanistanAlbaniaAlgeriaAndorraAngolaAntigua and BarbudaArab WorldArgentinaArmeniaAustraliaAustriaAzerbaijanBahamas, TheBahrainBangladeshBarbadosBelarusBelgiumBelizeBeninBermudaBhutanBoliviaBosnia and HerzegovinaBotswanaBrazilBrunei DarussalamBulgariaBurkina FasoBurundiCabo VerdeCambodiaCameroonCanadaCaribbean small statesCentral African RepublicCentral Europe and the BalticsChadChannel IslandsChileChinaColombiaComorosCongo, Dem. Rep.Congo, Rep.Costa RicaCote d'IvoireCroatiaCubaCyprusCzech RepublicDenmarkDjiboutiDominicaDominican RepublicEarly-demographic dividendEast Asia & PacificEast Asia & Pacific (excluding high income)East Asia & Pacific (IDA & IBRD countries)EcuadorEgypt, Arab Rep.El SalvadorEquatorial GuineaEritreaEstoniaEthiopiaEuro areaEurope & Central AsiaEurope & Central Asia (excluding high income)Europe & Central Asia (IDA & IBRD countries)European UnionFijiFinlandFragile and conflict affected situationsFranceFrench PolynesiaGabonGambia, TheGeorgiaGermanyGhanaGreeceGreenlandGrenadaGuatemalaGuineaGuinea-BissauGuyanaHaitiHeavily indebted poor countries (HIPC)High incomeHondurasHong Kong SAR, ChinaHungaryIBRD onlyIcelandIDA & IBRD totalIDA blendIDA onlyIDA totalIndiaIndonesiaIran, Islamic Rep.IraqIrelandIsle of ManIsraelItalyJamaicaJapanJordanKazakhstanKenyaKiribatiKorea, Rep.KosovoKuwaitKyrgyz RepublicLao PDRLate-demographic dividendLatin America & Caribbean Latin America & Caribbean (excluding high income)Latin America & the Caribbean (IDA & IBRD countries)LatviaLeast developed countries: UN classificationLebanonLesothoLiberiaLibyaLiechtensteinLithuaniaLow & middle incomeLow incomeLower middle incomeLuxembourgMacao SAR, ChinaMacedonia, FYRMadagascarMalawiMalaysiaMaldivesMaliMaltaMarshall IslandsMauritaniaMauritiusMexicoMicronesia, Fed. Sts.Middle East & North AfricaMiddle East & North Africa (excluding high income)Middle East & North Africa (IDA & IBRD countries)Middle incomeMoldovaMonacoMongoliaMontenegroMoroccoMozambiqueMyanmarNamibiaNauruNepalNetherlandsNew CaledoniaNew ZealandNicaraguaNigerNigeriaNorth AmericaNorwayOECD membersOmanOther small statesPacific island small statesPakistanPalauPanamaPapua New GuineaParaguayPeruPhilippinesPolandPortugalPost-demographic dividendPre-demographic dividendPuerto RicoQatarRomaniaRussian FederationRwandaSamoaSan MarinoSao Tome and PrincipeSaudi ArabiaSenegalSerbiaSeychellesSierra LeoneSingaporeSlovak RepublicSloveniaSmall statesSolomon IslandsSouth AfricaSouth AsiaSouth Asia (IDA & IBRD)South SudanSpainSri LankaSt. Kitts and NevisSt. LuciaSt. Vincent and the GrenadinesSub-Saharan Africa Sub-Saharan Africa (excluding high income)Sub-Saharan Africa (IDA & IBRD countries)SudanSurinameSwazilandSwedenSwitzerlandSyrian Arab RepublicTajikistanTanzaniaThailandTimor-LesteTogoTongaTrinidad and TobagoTunisiaTurkeyTurkmenistanTuvaluUgandaUkraineUnited Arab EmiratesUnited KingdomUnited StatesUpper middle incomeUruguayUzbekistanVanuatuVenezuela, RBVietnamVirgin Islands (U.S.)West Bank and GazaWorldYemen, Rep.ZambiaZimbabwe Timeline:
This timeline shows a graph from 1983 to 2016 of Comoros. No data until 1982. Number of actual observations by date: 34.
Source name:
World Development Indicators
Source organization:
World Bank national accounts data, and OECD National Accounts data files.
Categories, topics:
Economy & Growth
Last updated:
apr 23, 2017
Indicators value changes by year
Minimum:
110.895 mln
jan 1, 1985
Maximum:
630.055 mln
jan 1, 2015
At the date of observation
Value
Absolute change
Change from previous value
jan 1, 1983
126.216 mln
+126.216 mln
0.0%
jan 1, 1984
114.596 mln
-11.621 mln
-9.21%
jan 1, 1985
110.895 mln
-3.701 mln
-3.23%
jan 1, 1986
112.711 mln
+1.816 mln
1.64%
jan 1, 1987
131.212 mln
+18.501 mln
16.41%
jan 1, 1988
169.633 mln
+38.421 mln
29.28%
jan 1, 1989
214.76 mln
+45.126 mln
26.6%
jan 1, 1990
216.759 mln
+1.999 mln
0.93%
jan 1, 1991
234.125 mln
+17.366 mln
8.01%
jan 1, 1992
234.604 mln
+479.399K
0.2%
jan 1, 1993
280.846 mln
+46.242 mln
19.71%
jan 1, 1994
284.221 mln
+3.376 mln
1.2%
jan 1, 1995
234.545 mln
-49.676 mln
-17.48%
jan 1, 1996
234.465 mln
-80.431K
-0.03%
jan 1, 1997
222.637 mln
-11.828 mln
-5.04%
jan 1, 1998
231.771 mln
+9.134 mln
4.1%
jan 1, 1999
218.897 mln
-12.874 mln
-5.55%
jan 1, 2000
216.725 mln
-2.172 mln
-0.99%
jan 1, 2001
229.232 mln
+12.507 mln
5.77%
jan 1, 2002
225.321 mln
-3.911 mln
-1.71%
jan 1, 2003
224.226 mln
-1.095 mln
-0.49%
jan 1, 2004
265.604 mln
+41.378 mln
18.45%
jan 1, 2005
327.555 mln
+61.952 mln
23.32%
jan 1, 2006
386.071 mln
+58.515 mln
17.86%
jan 1, 2007
411.646 mln
+25.575 mln
6.62%
jan 1, 2008
435.546 mln
+23.9 mln
5.81%
jan 1, 2009
478.046 mln
+42.5 mln
9.76%
jan 1, 2010
522.775 mln
+44.729 mln
9.36%
jan 1, 2011
542.556 mln
+19.782 mln
3.78%
jan 1, 2012
566.085 mln
+23.529 mln
4.34%
jan 1, 2013
583.693 mln
+17.608 mln
3.11%
jan 1, 2014
617.777 mln
+34.084 mln
5.84%
jan 1, 2015
630.055 mln
+12.278 mln
1.99%
jan 1, 2016
612.559 mln
-17.496 mln
-2.78%
Ranking of countries by current statistics by years


Comments: