29
/
en
AIzaSyAYiBZKx7MnpbEhh9jyipgxe19OcubqV5w
April 1, 2024
195579
Mexico
MEX
true
2
1
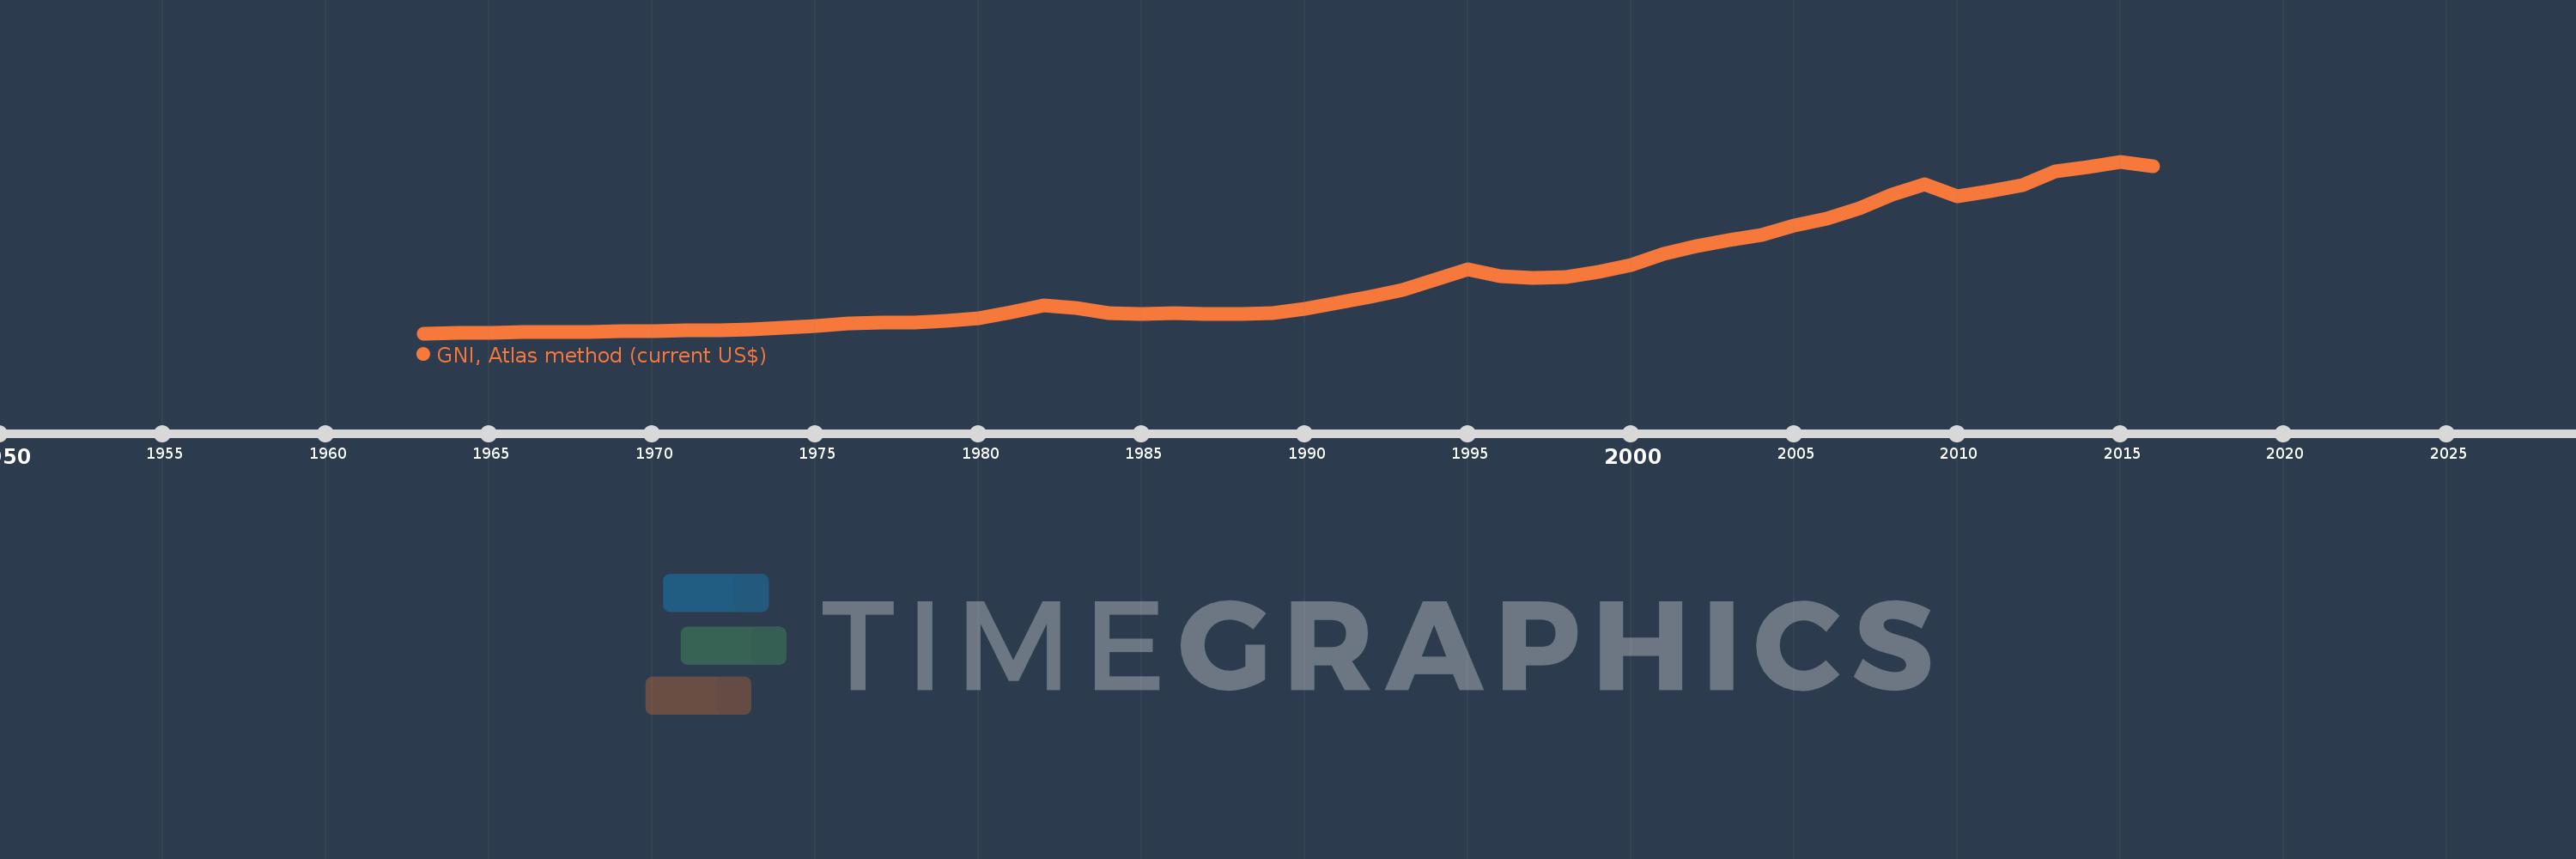
GNI, Atlas method (current US$)
2016,2015,2014,2013,2012,2011,2010,2009,2008,2007,2006,2005,2004,2003,2002,2001,2000,1999,1998,1997,1996,1995,1994,1993,1992,1991,1990,1989,1988,1987,1986,1985,1984,1983,1982,1981,1980,1979,1978,1977,1976,1975,1974,1973,1972,1971,1970,1969,1968,1967,1966,1965,1964,1963
This statistics in other country:
AfghanistanAlbaniaAlgeriaAndorraAngolaAntigua and BarbudaArab WorldArgentinaArmeniaAustraliaAustriaAzerbaijanBahamas, TheBahrainBangladeshBarbadosBelarusBelgiumBelizeBeninBermudaBhutanBoliviaBosnia and HerzegovinaBotswanaBrazilBrunei DarussalamBulgariaBurkina FasoBurundiCabo VerdeCambodiaCameroonCanadaCaribbean small statesCentral African RepublicCentral Europe and the BalticsChadChannel IslandsChileChinaColombiaComorosCongo, Dem. Rep.Congo, Rep.Costa RicaCote d'IvoireCroatiaCubaCyprusCzech RepublicDenmarkDjiboutiDominicaDominican RepublicEarly-demographic dividendEast Asia & PacificEast Asia & Pacific (excluding high income)East Asia & Pacific (IDA & IBRD countries)EcuadorEgypt, Arab Rep.El SalvadorEquatorial GuineaEritreaEstoniaEthiopiaEuro areaEurope & Central AsiaEurope & Central Asia (excluding high income)Europe & Central Asia (IDA & IBRD countries)European UnionFijiFinlandFragile and conflict affected situationsFranceFrench PolynesiaGabonGambia, TheGeorgiaGermanyGhanaGreeceGreenlandGrenadaGuatemalaGuineaGuinea-BissauGuyanaHaitiHeavily indebted poor countries (HIPC)High incomeHondurasHong Kong SAR, ChinaHungaryIBRD onlyIcelandIDA & IBRD totalIDA blendIDA onlyIDA totalIndiaIndonesiaIran, Islamic Rep.IraqIrelandIsle of ManIsraelItalyJamaicaJapanJordanKazakhstanKenyaKiribatiKorea, Rep.KosovoKuwaitKyrgyz RepublicLao PDRLate-demographic dividendLatin America & Caribbean Latin America & Caribbean (excluding high income)Latin America & the Caribbean (IDA & IBRD countries)LatviaLeast developed countries: UN classificationLebanonLesothoLiberiaLibyaLiechtensteinLithuaniaLow & middle incomeLow incomeLower middle incomeLuxembourgMacao SAR, ChinaMacedonia, FYRMadagascarMalawiMalaysiaMaldivesMaliMaltaMarshall IslandsMauritaniaMauritiusMexicoMicronesia, Fed. Sts.Middle East & North AfricaMiddle East & North Africa (excluding high income)Middle East & North Africa (IDA & IBRD countries)Middle incomeMoldovaMonacoMongoliaMontenegroMoroccoMozambiqueMyanmarNamibiaNauruNepalNetherlandsNew CaledoniaNew ZealandNicaraguaNigerNigeriaNorth AmericaNorwayOECD membersOmanOther small statesPacific island small statesPakistanPalauPanamaPapua New GuineaParaguayPeruPhilippinesPolandPortugalPost-demographic dividendPre-demographic dividendPuerto RicoQatarRomaniaRussian FederationRwandaSamoaSan MarinoSao Tome and PrincipeSaudi ArabiaSenegalSerbiaSeychellesSierra LeoneSingaporeSlovak RepublicSloveniaSmall statesSolomon IslandsSouth AfricaSouth AsiaSouth Asia (IDA & IBRD)South SudanSpainSri LankaSt. Kitts and NevisSt. LuciaSt. Vincent and the GrenadinesSub-Saharan Africa Sub-Saharan Africa (excluding high income)Sub-Saharan Africa (IDA & IBRD countries)SudanSurinameSwazilandSwedenSwitzerlandSyrian Arab RepublicTajikistanTanzaniaThailandTimor-LesteTogoTongaTrinidad and TobagoTunisiaTurkeyTurkmenistanTuvaluUgandaUkraineUnited Arab EmiratesUnited KingdomUnited StatesUpper middle incomeUruguayUzbekistanVanuatuVenezuela, RBVietnamVirgin Islands (U.S.)West Bank and GazaWorldYemen, Rep.ZambiaZimbabwe Timeline:
This timeline shows a graph from 1963 to 2016 of Mexico. No data until 1962. Number of actual observations by date: 54.
Source name:
World Development Indicators
Source organization:
World Bank national accounts data, and OECD National Accounts data files.
Categories, topics:
Economy & Growth
Last updated:
apr 23, 2017
Indicators value changes by year
Minimum:
14.67 bln
jan 1, 1963
Maximum:
1.265 trl
jan 1, 2015
At the date of observation
Value
Absolute change
Change from previous value
jan 1, 1963
14.67 bln
+14.67 bln
0.0%
jan 1, 1964
16.308 bln
+1.638 bln
11.17%
jan 1, 1965
18.852 bln
+2.544 bln
15.6%
jan 1, 1966
21.094 bln
+2.242 bln
11.89%
jan 1, 1967
23.4 bln
+2.306 bln
10.93%
jan 1, 1968
26.062 bln
+2.662 bln
11.38%
jan 1, 1969
29.682 bln
+3.621 bln
13.89%
jan 1, 1970
31.998 bln
+2.316 bln
7.8%
jan 1, 1971
35.289 bln
+3.29 bln
10.28%
jan 1, 1972
38.713 bln
+3.425 bln
9.7%
jan 1, 1973
44.863 bln
+6.15 bln
15.89%
jan 1, 1974
55.642 bln
+10.779 bln
24.03%
jan 1, 1975
70.183 bln
+14.541 bln
26.13%
jan 1, 1976
87.082 bln
+16.899 bln
24.08%
jan 1, 1977
94.129 bln
+7.048 bln
8.09%
jan 1, 1978
92.842 bln
-1.287 bln
-1.37%
jan 1, 1979
102.394 bln
+9.552 bln
10.29%
jan 1, 1980
125.208 bln
+22.814 bln
22.28%
jan 1, 1981
170.599 bln
+45.391 bln
36.25%
jan 1, 1982
219.379 bln
+48.781 bln
28.59%
jan 1, 1983
200.314 bln
-19.065 bln
-8.69%
jan 1, 1984
164.264 bln
-36.05 bln
-18.0%
jan 1, 1985
154.799 bln
-9.465 bln
-5.76%
jan 1, 1986
164.393 bln
+9.594 bln
6.2%
jan 1, 1987
153.009 bln
-11.385 bln
-6.93%
jan 1, 1988
153.828 bln
+819.365 mln
0.54%
jan 1, 1989
164.207 bln
+10.378 bln
6.75%
jan 1, 1990
192.819 bln
+28.612 bln
17.42%
jan 1, 1991
235.631 bln
+42.812 bln
22.2%
jan 1, 1992
279.203 bln
+43.572 bln
18.49%
jan 1, 1993
329.499 bln
+50.296 bln
18.01%
jan 1, 1994
405.443 bln
+75.944 bln
23.05%
jan 1, 1995
482.171 bln
+76.728 bln
18.92%
jan 1, 1996
431.156 bln
-51.015 bln
-10.58%
jan 1, 1997
415.808 bln
-15.349 bln
-3.56%
jan 1, 1998
421.691 bln
+5.884 bln
1.41%
jan 1, 1999
459.635 bln
+37.943 bln
9.0%
jan 1, 2000
514.33 bln
+54.695 bln
11.9%
jan 1, 2001
591.218 bln
+76.888 bln
14.95%
jan 1, 2002
650.808 bln
+59.59 bln
10.08%
jan 1, 2003
694.386 bln
+43.578 bln
6.7%
jan 1, 2004
733.578 bln
+39.192 bln
5.64%
jan 1, 2005
799.778 bln
+66.2 bln
9.02%
jan 1, 2006
846.883 bln
+47.104 bln
5.89%
jan 1, 2007
921.879 bln
+74.996 bln
8.86%
jan 1, 2008
1.027 trl
+105.516 bln
11.45%
jan 1, 2009
1.101 trl
+73.541 bln
7.16%
jan 1, 2010
1.015 trl
-85.974 bln
-7.81%
jan 1, 2011
1.049 trl
+34.023 bln
3.35%
jan 1, 2012
1.092 trl
+43.455 bln
4.14%
jan 1, 2013
1.193 trl
+100.647 bln
9.21%
jan 1, 2014
1.228 trl
+34.57 bln
2.9%
jan 1, 2015
1.265 trl
+37.785 bln
3.08%
jan 1, 2016
1.233 trl
-32.381 bln
-2.56%
Ranking of countries by current statistics by years


Comments: