29
/
en
AIzaSyAYiBZKx7MnpbEhh9jyipgxe19OcubqV5w
April 1, 2024
191431
Malta
MLT
true
2
1
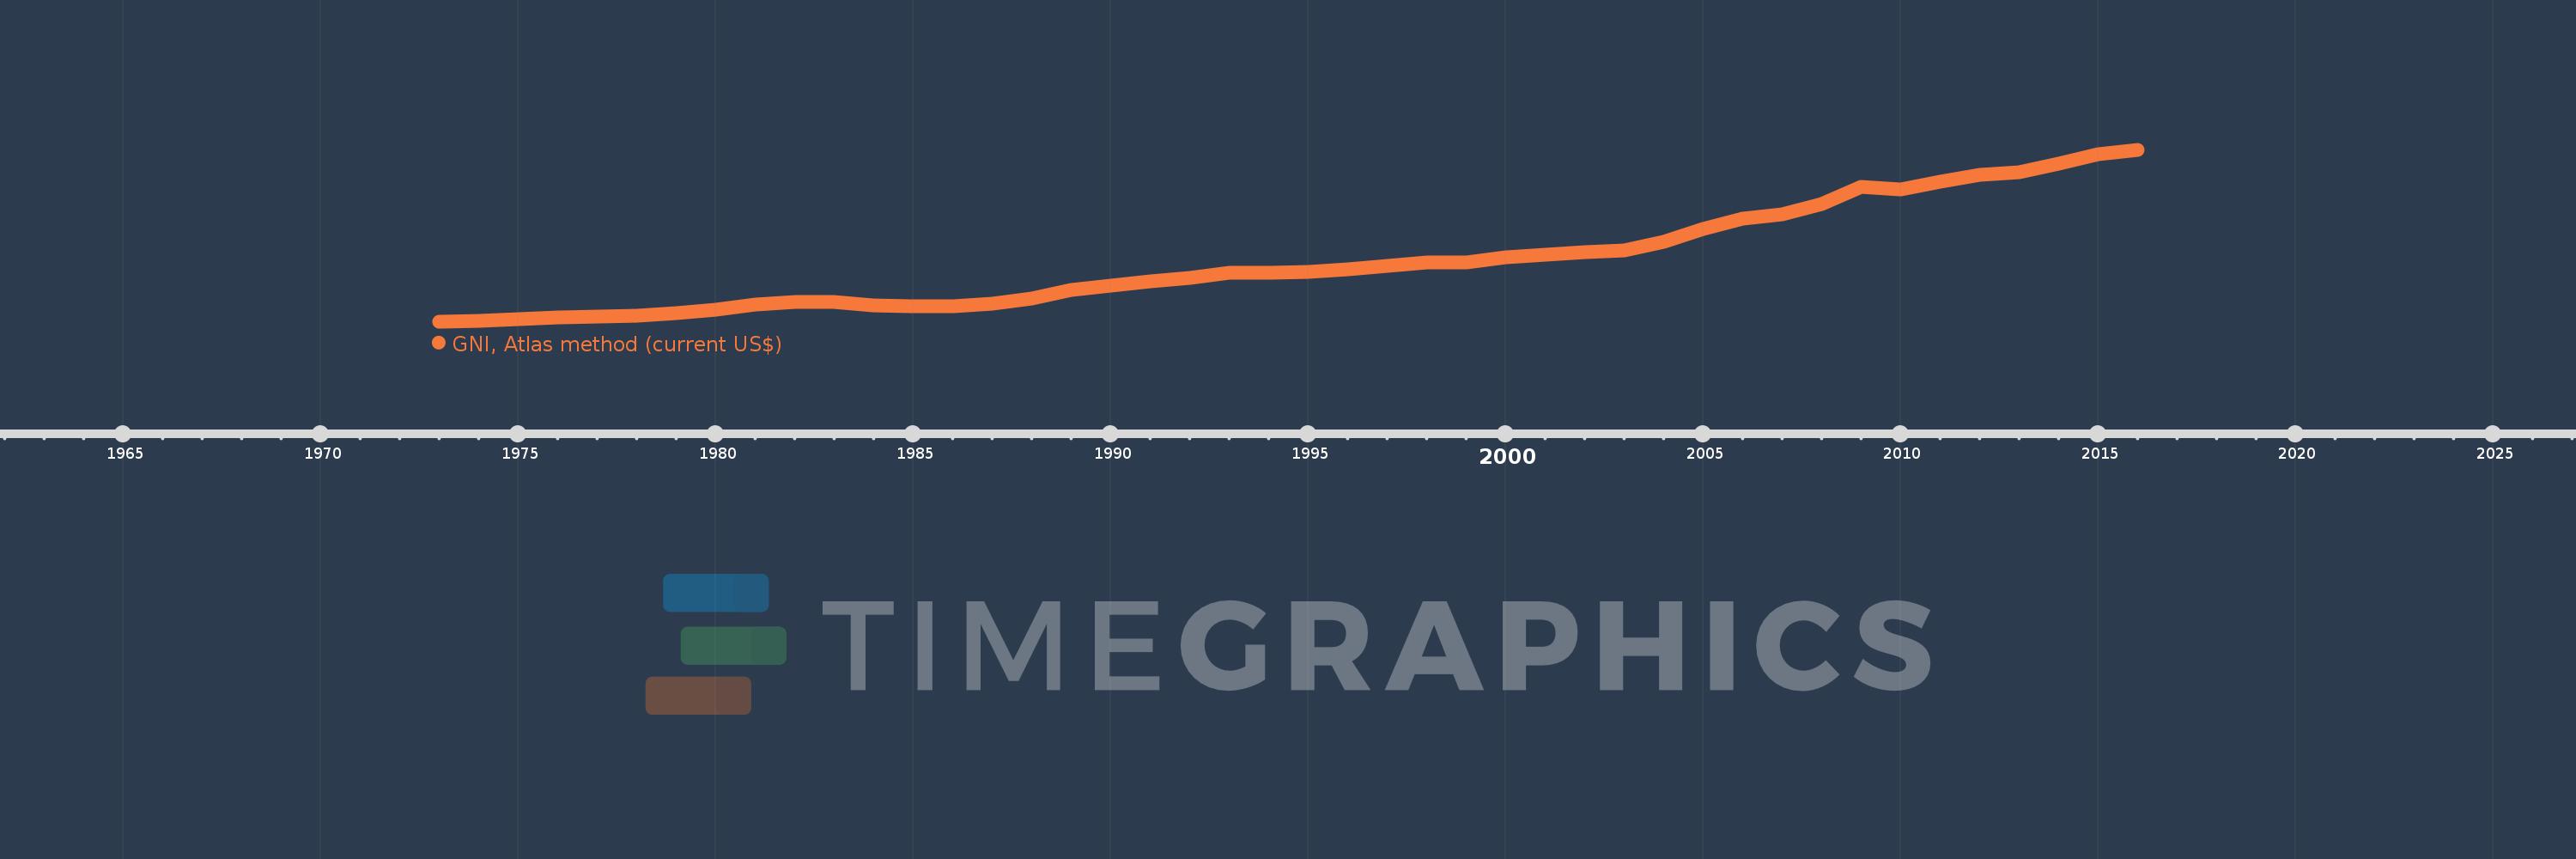
GNI, Atlas method (current US$)
2016,2015,2014,2013,2012,2011,2010,2009,2008,2007,2006,2005,2004,2003,2002,2001,2000,1999,1998,1997,1996,1995,1994,1993,1992,1991,1990,1989,1988,1987,1986,1985,1984,1983,1982,1981,1980,1979,1978,1977,1976,1975,1974,1973
This statistics in other country:
AfghanistanAlbaniaAlgeriaAndorraAngolaAntigua and BarbudaArab WorldArgentinaArmeniaAustraliaAustriaAzerbaijanBahamas, TheBahrainBangladeshBarbadosBelarusBelgiumBelizeBeninBermudaBhutanBoliviaBosnia and HerzegovinaBotswanaBrazilBrunei DarussalamBulgariaBurkina FasoBurundiCabo VerdeCambodiaCameroonCanadaCaribbean small statesCentral African RepublicCentral Europe and the BalticsChadChannel IslandsChileChinaColombiaComorosCongo, Dem. Rep.Congo, Rep.Costa RicaCote d'IvoireCroatiaCubaCyprusCzech RepublicDenmarkDjiboutiDominicaDominican RepublicEarly-demographic dividendEast Asia & PacificEast Asia & Pacific (excluding high income)East Asia & Pacific (IDA & IBRD countries)EcuadorEgypt, Arab Rep.El SalvadorEquatorial GuineaEritreaEstoniaEthiopiaEuro areaEurope & Central AsiaEurope & Central Asia (excluding high income)Europe & Central Asia (IDA & IBRD countries)European UnionFijiFinlandFragile and conflict affected situationsFranceFrench PolynesiaGabonGambia, TheGeorgiaGermanyGhanaGreeceGreenlandGrenadaGuatemalaGuineaGuinea-BissauGuyanaHaitiHeavily indebted poor countries (HIPC)High incomeHondurasHong Kong SAR, ChinaHungaryIBRD onlyIcelandIDA & IBRD totalIDA blendIDA onlyIDA totalIndiaIndonesiaIran, Islamic Rep.IraqIrelandIsle of ManIsraelItalyJamaicaJapanJordanKazakhstanKenyaKiribatiKorea, Rep.KosovoKuwaitKyrgyz RepublicLao PDRLate-demographic dividendLatin America & Caribbean Latin America & Caribbean (excluding high income)Latin America & the Caribbean (IDA & IBRD countries)LatviaLeast developed countries: UN classificationLebanonLesothoLiberiaLibyaLiechtensteinLithuaniaLow & middle incomeLow incomeLower middle incomeLuxembourgMacao SAR, ChinaMacedonia, FYRMadagascarMalawiMalaysiaMaldivesMaliMaltaMarshall IslandsMauritaniaMauritiusMexicoMicronesia, Fed. Sts.Middle East & North AfricaMiddle East & North Africa (excluding high income)Middle East & North Africa (IDA & IBRD countries)Middle incomeMoldovaMonacoMongoliaMontenegroMoroccoMozambiqueMyanmarNamibiaNauruNepalNetherlandsNew CaledoniaNew ZealandNicaraguaNigerNigeriaNorth AmericaNorwayOECD membersOmanOther small statesPacific island small statesPakistanPalauPanamaPapua New GuineaParaguayPeruPhilippinesPolandPortugalPost-demographic dividendPre-demographic dividendPuerto RicoQatarRomaniaRussian FederationRwandaSamoaSan MarinoSao Tome and PrincipeSaudi ArabiaSenegalSerbiaSeychellesSierra LeoneSingaporeSlovak RepublicSloveniaSmall statesSolomon IslandsSouth AfricaSouth AsiaSouth Asia (IDA & IBRD)South SudanSpainSri LankaSt. Kitts and NevisSt. LuciaSt. Vincent and the GrenadinesSub-Saharan Africa Sub-Saharan Africa (excluding high income)Sub-Saharan Africa (IDA & IBRD countries)SudanSurinameSwazilandSwedenSwitzerlandSyrian Arab RepublicTajikistanTanzaniaThailandTimor-LesteTogoTongaTrinidad and TobagoTunisiaTurkeyTurkmenistanTuvaluUgandaUkraineUnited Arab EmiratesUnited KingdomUnited StatesUpper middle incomeUruguayUzbekistanVanuatuVenezuela, RBVietnamVirgin Islands (U.S.)West Bank and GazaWorldYemen, Rep.ZambiaZimbabwe Timeline:
This timeline shows a graph from 1973 to 2016 of Malta. No data until 1972. Number of actual observations by date: 44.
Source name:
World Development Indicators
Source organization:
World Bank national accounts data, and OECD National Accounts data files.
Categories, topics:
Economy & Growth
Last updated:
apr 23, 2017
Indicators value changes by year
Minimum:
328.388 mln
jan 1, 1973
Maximum:
10.322 bln
jan 1, 2016
At the date of observation
Value
Absolute change
Change from previous value
jan 1, 1973
328.388 mln
+328.388 mln
0.0%
jan 1, 1974
379.736 mln
+51.348 mln
15.64%
jan 1, 1975
471.853 mln
+92.116 mln
24.26%
jan 1, 1976
604.296 mln
+132.444 mln
28.07%
jan 1, 1977
649.078 mln
+44.782 mln
7.41%
jan 1, 1978
710.872 mln
+61.794 mln
9.52%
jan 1, 1979
824.133 mln
+113.261 mln
15.93%
jan 1, 1980
1.034 bln
+209.823 mln
25.46%
jan 1, 1981
1.355 bln
+320.552 mln
31.0%
jan 1, 1982
1.49 bln
+135.61 mln
10.01%
jan 1, 1983
1.483 bln
-7.288 mln
-0.49%
jan 1, 1984
1.303 bln
-180.271 mln
-12.16%
jan 1, 1985
1.265 bln
-37.106 mln
-2.85%
jan 1, 1986
1.24 bln
-25.4 mln
-2.01%
jan 1, 1987
1.37 bln
+129.502 mln
10.44%
jan 1, 1988
1.699 bln
+329.308 mln
24.04%
jan 1, 1989
2.175 bln
+476.074 mln
28.02%
jan 1, 1990
2.425 bln
+250.085 mln
11.5%
jan 1, 1991
2.69 bln
+264.927 mln
10.92%
jan 1, 1992
2.889 bln
+199.195 mln
7.41%
jan 1, 1993
3.204 bln
+315.076 mln
10.91%
jan 1, 1994
3.181 bln
-23.007 mln
-0.72%
jan 1, 1995
3.222 bln
+40.719 mln
1.28%
jan 1, 1996
3.394 bln
+171.998 mln
5.34%
jan 1, 1997
3.606 bln
+211.809 mln
6.24%
jan 1, 1998
3.787 bln
+181.198 mln
5.03%
jan 1, 1999
3.78 bln
-7.245 mln
-0.19%
jan 1, 2000
4.073 bln
+293.463 mln
7.76%
jan 1, 2001
4.259 bln
+186.158 mln
4.57%
jan 1, 2002
4.385 bln
+125.999 mln
2.96%
jan 1, 2003
4.505 bln
+119.226 mln
2.72%
jan 1, 2004
4.986 bln
+481.595 mln
10.69%
jan 1, 2005
5.739 bln
+752.987 mln
15.1%
jan 1, 2006
6.323 bln
+583.782 mln
10.17%
jan 1, 2007
6.611 bln
+288.046 mln
4.56%
jan 1, 2008
7.206 bln
+595.328 mln
9.01%
jan 1, 2009
8.168 bln
+961.779 mln
13.35%
jan 1, 2010
8.053 bln
-115.473 mln
-1.41%
jan 1, 2011
8.512 bln
+459.06 mln
5.7%
jan 1, 2012
8.866 bln
+354.708 mln
4.17%
jan 1, 2013
9.052 bln
+185.387 mln
2.09%
jan 1, 2014
9.534 bln
+482.325 mln
5.33%
jan 1, 2015
10.099 bln
+564.521 mln
5.92%
jan 1, 2016
10.322 bln
+223.071 mln
2.21%
Ranking of countries by current statistics by years


Comments: