29
/
en
AIzaSyAYiBZKx7MnpbEhh9jyipgxe19OcubqV5w
April 1, 2024
205295
Namibia
NAM
true
2
1
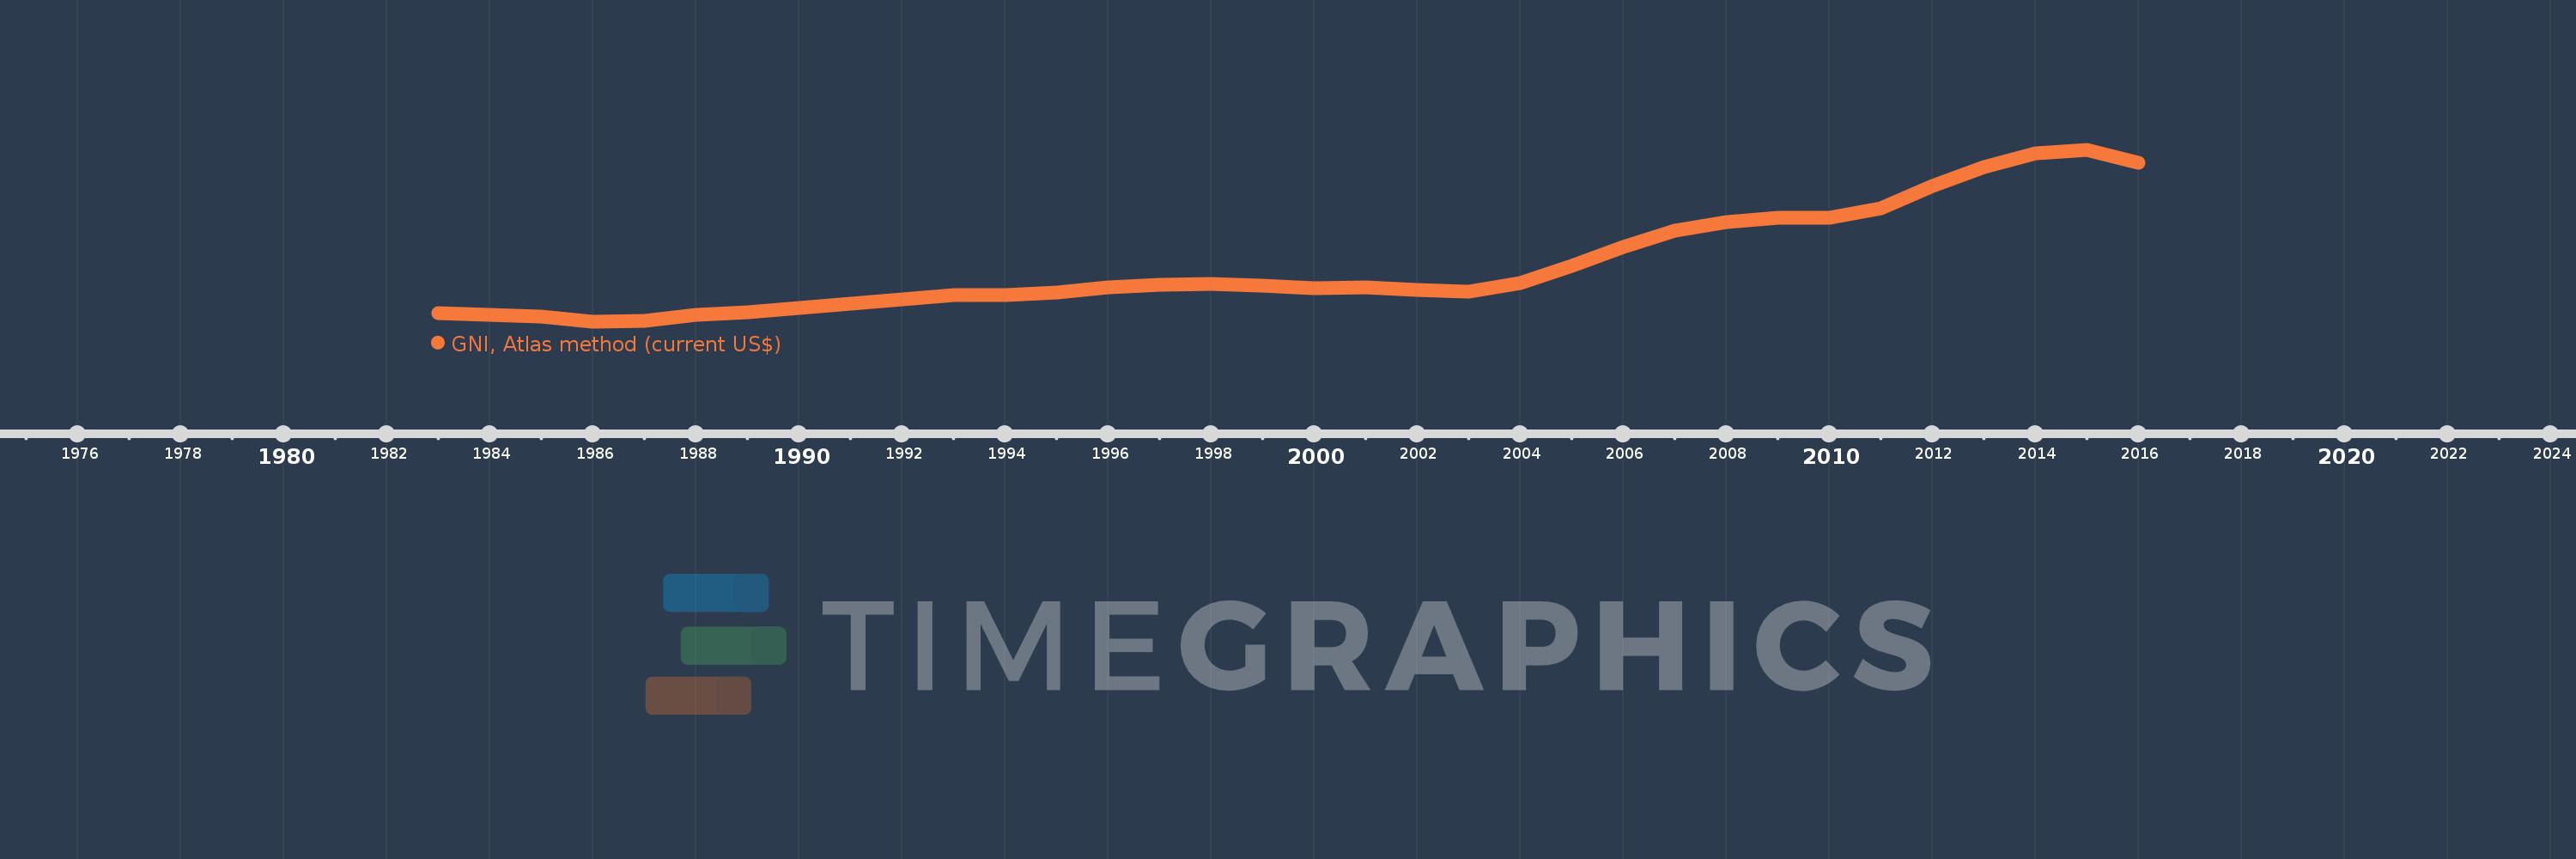
GNI, Atlas method (current US$)
2016,2015,2014,2013,2012,2011,2010,2009,2008,2007,2006,2005,2004,2003,2002,2001,2000,1999,1998,1997,1996,1995,1994,1993,1992,1991,1990,1989,1988,1987,1986,1985,1984,1983
This statistics in other country:
AfghanistanAlbaniaAlgeriaAndorraAngolaAntigua and BarbudaArab WorldArgentinaArmeniaAustraliaAustriaAzerbaijanBahamas, TheBahrainBangladeshBarbadosBelarusBelgiumBelizeBeninBermudaBhutanBoliviaBosnia and HerzegovinaBotswanaBrazilBrunei DarussalamBulgariaBurkina FasoBurundiCabo VerdeCambodiaCameroonCanadaCaribbean small statesCentral African RepublicCentral Europe and the BalticsChadChannel IslandsChileChinaColombiaComorosCongo, Dem. Rep.Congo, Rep.Costa RicaCote d'IvoireCroatiaCubaCyprusCzech RepublicDenmarkDjiboutiDominicaDominican RepublicEarly-demographic dividendEast Asia & PacificEast Asia & Pacific (excluding high income)East Asia & Pacific (IDA & IBRD countries)EcuadorEgypt, Arab Rep.El SalvadorEquatorial GuineaEritreaEstoniaEthiopiaEuro areaEurope & Central AsiaEurope & Central Asia (excluding high income)Europe & Central Asia (IDA & IBRD countries)European UnionFijiFinlandFragile and conflict affected situationsFranceFrench PolynesiaGabonGambia, TheGeorgiaGermanyGhanaGreeceGreenlandGrenadaGuatemalaGuineaGuinea-BissauGuyanaHaitiHeavily indebted poor countries (HIPC)High incomeHondurasHong Kong SAR, ChinaHungaryIBRD onlyIcelandIDA & IBRD totalIDA blendIDA onlyIDA totalIndiaIndonesiaIran, Islamic Rep.IraqIrelandIsle of ManIsraelItalyJamaicaJapanJordanKazakhstanKenyaKiribatiKorea, Rep.KosovoKuwaitKyrgyz RepublicLao PDRLate-demographic dividendLatin America & Caribbean Latin America & Caribbean (excluding high income)Latin America & the Caribbean (IDA & IBRD countries)LatviaLeast developed countries: UN classificationLebanonLesothoLiberiaLibyaLiechtensteinLithuaniaLow & middle incomeLow incomeLower middle incomeLuxembourgMacao SAR, ChinaMacedonia, FYRMadagascarMalawiMalaysiaMaldivesMaliMaltaMarshall IslandsMauritaniaMauritiusMexicoMicronesia, Fed. Sts.Middle East & North AfricaMiddle East & North Africa (excluding high income)Middle East & North Africa (IDA & IBRD countries)Middle incomeMoldovaMonacoMongoliaMontenegroMoroccoMozambiqueMyanmarNamibiaNauruNepalNetherlandsNew CaledoniaNew ZealandNicaraguaNigerNigeriaNorth AmericaNorwayOECD membersOmanOther small statesPacific island small statesPakistanPalauPanamaPapua New GuineaParaguayPeruPhilippinesPolandPortugalPost-demographic dividendPre-demographic dividendPuerto RicoQatarRomaniaRussian FederationRwandaSamoaSan MarinoSao Tome and PrincipeSaudi ArabiaSenegalSerbiaSeychellesSierra LeoneSingaporeSlovak RepublicSloveniaSmall statesSolomon IslandsSouth AfricaSouth AsiaSouth Asia (IDA & IBRD)South SudanSpainSri LankaSt. Kitts and NevisSt. LuciaSt. Vincent and the GrenadinesSub-Saharan Africa Sub-Saharan Africa (excluding high income)Sub-Saharan Africa (IDA & IBRD countries)SudanSurinameSwazilandSwedenSwitzerlandSyrian Arab RepublicTajikistanTanzaniaThailandTimor-LesteTogoTongaTrinidad and TobagoTunisiaTurkeyTurkmenistanTuvaluUgandaUkraineUnited Arab EmiratesUnited KingdomUnited StatesUpper middle incomeUruguayUzbekistanVanuatuVenezuela, RBVietnamVirgin Islands (U.S.)West Bank and GazaWorldYemen, Rep.ZambiaZimbabwe Timeline:
This timeline shows a graph from 1983 to 2016 of Namibia. No data until 1982. Number of actual observations by date: 34.
Source name:
World Development Indicators
Source organization:
World Bank national accounts data, and OECD National Accounts data files.
Categories, topics:
Economy & Growth
Last updated:
apr 23, 2017
Indicators value changes by year
Minimum:
1.583 bln
jan 1, 1986
Maximum:
13.643 bln
jan 1, 2015
At the date of observation
Value
Absolute change
Change from previous value
jan 1, 1983
2.193 bln
+2.193 bln
0.0%
jan 1, 1984
2.08 bln
-113.094 mln
-5.16%
jan 1, 1985
1.944 bln
-135.972 mln
-6.54%
jan 1, 1986
1.583 bln
-360.407 mln
-18.54%
jan 1, 1987
1.659 bln
+75.253 mln
4.75%
jan 1, 1988
2.062 bln
+403.634 mln
24.33%
jan 1, 1989
2.255 bln
+193.024 mln
9.36%
jan 1, 1990
2.57 bln
+314.19 mln
13.93%
jan 1, 1991
2.855 bln
+285.775 mln
11.12%
jan 1, 1992
3.175 bln
+319.238 mln
11.18%
jan 1, 1993
3.493 bln
+318.032 mln
10.02%
jan 1, 1994
3.457 bln
-35.121 mln
-1.01%
jan 1, 1995
3.628 bln
+170.733 mln
4.94%
jan 1, 1996
4.009 bln
+380.86 mln
10.5%
jan 1, 1997
4.175 bln
+165.664 mln
4.13%
jan 1, 1998
4.26 bln
+85.011 mln
2.04%
jan 1, 1999
4.108 bln
-152.047 mln
-3.57%
jan 1, 2000
3.954 bln
-153.352 mln
-3.73%
jan 1, 2001
4.004 bln
+49.852 mln
1.26%
jan 1, 2002
3.805 bln
-199.679 mln
-4.99%
jan 1, 2003
3.71 bln
-94.279 mln
-2.48%
jan 1, 2004
4.291 bln
+580.881 mln
15.66%
jan 1, 2005
5.536 bln
+1.245 bln
29.01%
jan 1, 2006
6.863 bln
+1.327 bln
23.96%
jan 1, 2007
7.965 bln
+1.103 bln
16.07%
jan 1, 2008
8.624 bln
+659.169 mln
8.28%
jan 1, 2009
8.891 bln
+266.241 mln
3.09%
jan 1, 2010
8.869 bln
-21.529 mln
-0.24%
jan 1, 2011
9.561 bln
+691.967 mln
7.8%
jan 1, 2012
11.124 bln
+1.563 bln
16.35%
jan 1, 2013
12.48 bln
+1.356 bln
12.19%
jan 1, 2014
13.441 bln
+960.986 mln
7.7%
jan 1, 2015
13.643 bln
+201.848 mln
1.5%
jan 1, 2016
12.77 bln
-872.198 mln
-6.39%
Ranking of countries by current statistics by years


Comments: