29
/
en
AIzaSyAYiBZKx7MnpbEhh9jyipgxe19OcubqV5w
April 1, 2024
229783
Russian Federation
RUS
true
2
1
GNI, Atlas method (current US$)
2016,2015,2014,2013,2012,2011,2010,2009,2008,2007,2006,2005,2004,2003,2002,2001,2000,1999,1998,1997,1996,1995,1994,1993,1992
This statistics in other country:
AfghanistanAlbaniaAlgeriaAndorraAngolaAntigua and BarbudaArab WorldArgentinaArmeniaAustraliaAustriaAzerbaijanBahamas, TheBahrainBangladeshBarbadosBelarusBelgiumBelizeBeninBermudaBhutanBoliviaBosnia and HerzegovinaBotswanaBrazilBrunei DarussalamBulgariaBurkina FasoBurundiCabo VerdeCambodiaCameroonCanadaCaribbean small statesCentral African RepublicCentral Europe and the BalticsChadChannel IslandsChileChinaColombiaComorosCongo, Dem. Rep.Congo, Rep.Costa RicaCote d'IvoireCroatiaCubaCyprusCzech RepublicDenmarkDjiboutiDominicaDominican RepublicEarly-demographic dividendEast Asia & PacificEast Asia & Pacific (excluding high income)East Asia & Pacific (IDA & IBRD countries)EcuadorEgypt, Arab Rep.El SalvadorEquatorial GuineaEritreaEstoniaEthiopiaEuro areaEurope & Central AsiaEurope & Central Asia (excluding high income)Europe & Central Asia (IDA & IBRD countries)European UnionFijiFinlandFragile and conflict affected situationsFranceFrench PolynesiaGabonGambia, TheGeorgiaGermanyGhanaGreeceGreenlandGrenadaGuatemalaGuineaGuinea-BissauGuyanaHaitiHeavily indebted poor countries (HIPC)High incomeHondurasHong Kong SAR, ChinaHungaryIBRD onlyIcelandIDA & IBRD totalIDA blendIDA onlyIDA totalIndiaIndonesiaIran, Islamic Rep.IraqIrelandIsle of ManIsraelItalyJamaicaJapanJordanKazakhstanKenyaKiribatiKorea, Rep.KosovoKuwaitKyrgyz RepublicLao PDRLate-demographic dividendLatin America & Caribbean Latin America & Caribbean (excluding high income)Latin America & the Caribbean (IDA & IBRD countries)LatviaLeast developed countries: UN classificationLebanonLesothoLiberiaLibyaLiechtensteinLithuaniaLow & middle incomeLow incomeLower middle incomeLuxembourgMacao SAR, ChinaMacedonia, FYRMadagascarMalawiMalaysiaMaldivesMaliMaltaMarshall IslandsMauritaniaMauritiusMexicoMicronesia, Fed. Sts.Middle East & North AfricaMiddle East & North Africa (excluding high income)Middle East & North Africa (IDA & IBRD countries)Middle incomeMoldovaMonacoMongoliaMontenegroMoroccoMozambiqueMyanmarNamibiaNauruNepalNetherlandsNew CaledoniaNew ZealandNicaraguaNigerNigeriaNorth AmericaNorwayOECD membersOmanOther small statesPacific island small statesPakistanPalauPanamaPapua New GuineaParaguayPeruPhilippinesPolandPortugalPost-demographic dividendPre-demographic dividendPuerto RicoQatarRomaniaRussian FederationRwandaSamoaSan MarinoSao Tome and PrincipeSaudi ArabiaSenegalSerbiaSeychellesSierra LeoneSingaporeSlovak RepublicSloveniaSmall statesSolomon IslandsSouth AfricaSouth AsiaSouth Asia (IDA & IBRD)South SudanSpainSri LankaSt. Kitts and NevisSt. LuciaSt. Vincent and the GrenadinesSub-Saharan Africa Sub-Saharan Africa (excluding high income)Sub-Saharan Africa (IDA & IBRD countries)SudanSurinameSwazilandSwedenSwitzerlandSyrian Arab RepublicTajikistanTanzaniaThailandTimor-LesteTogoTongaTrinidad and TobagoTunisiaTurkeyTurkmenistanTuvaluUgandaUkraineUnited Arab EmiratesUnited KingdomUnited StatesUpper middle incomeUruguayUzbekistanVanuatuVenezuela, RBVietnamVirgin Islands (U.S.)West Bank and GazaWorldYemen, Rep.ZambiaZimbabwe Timeline:
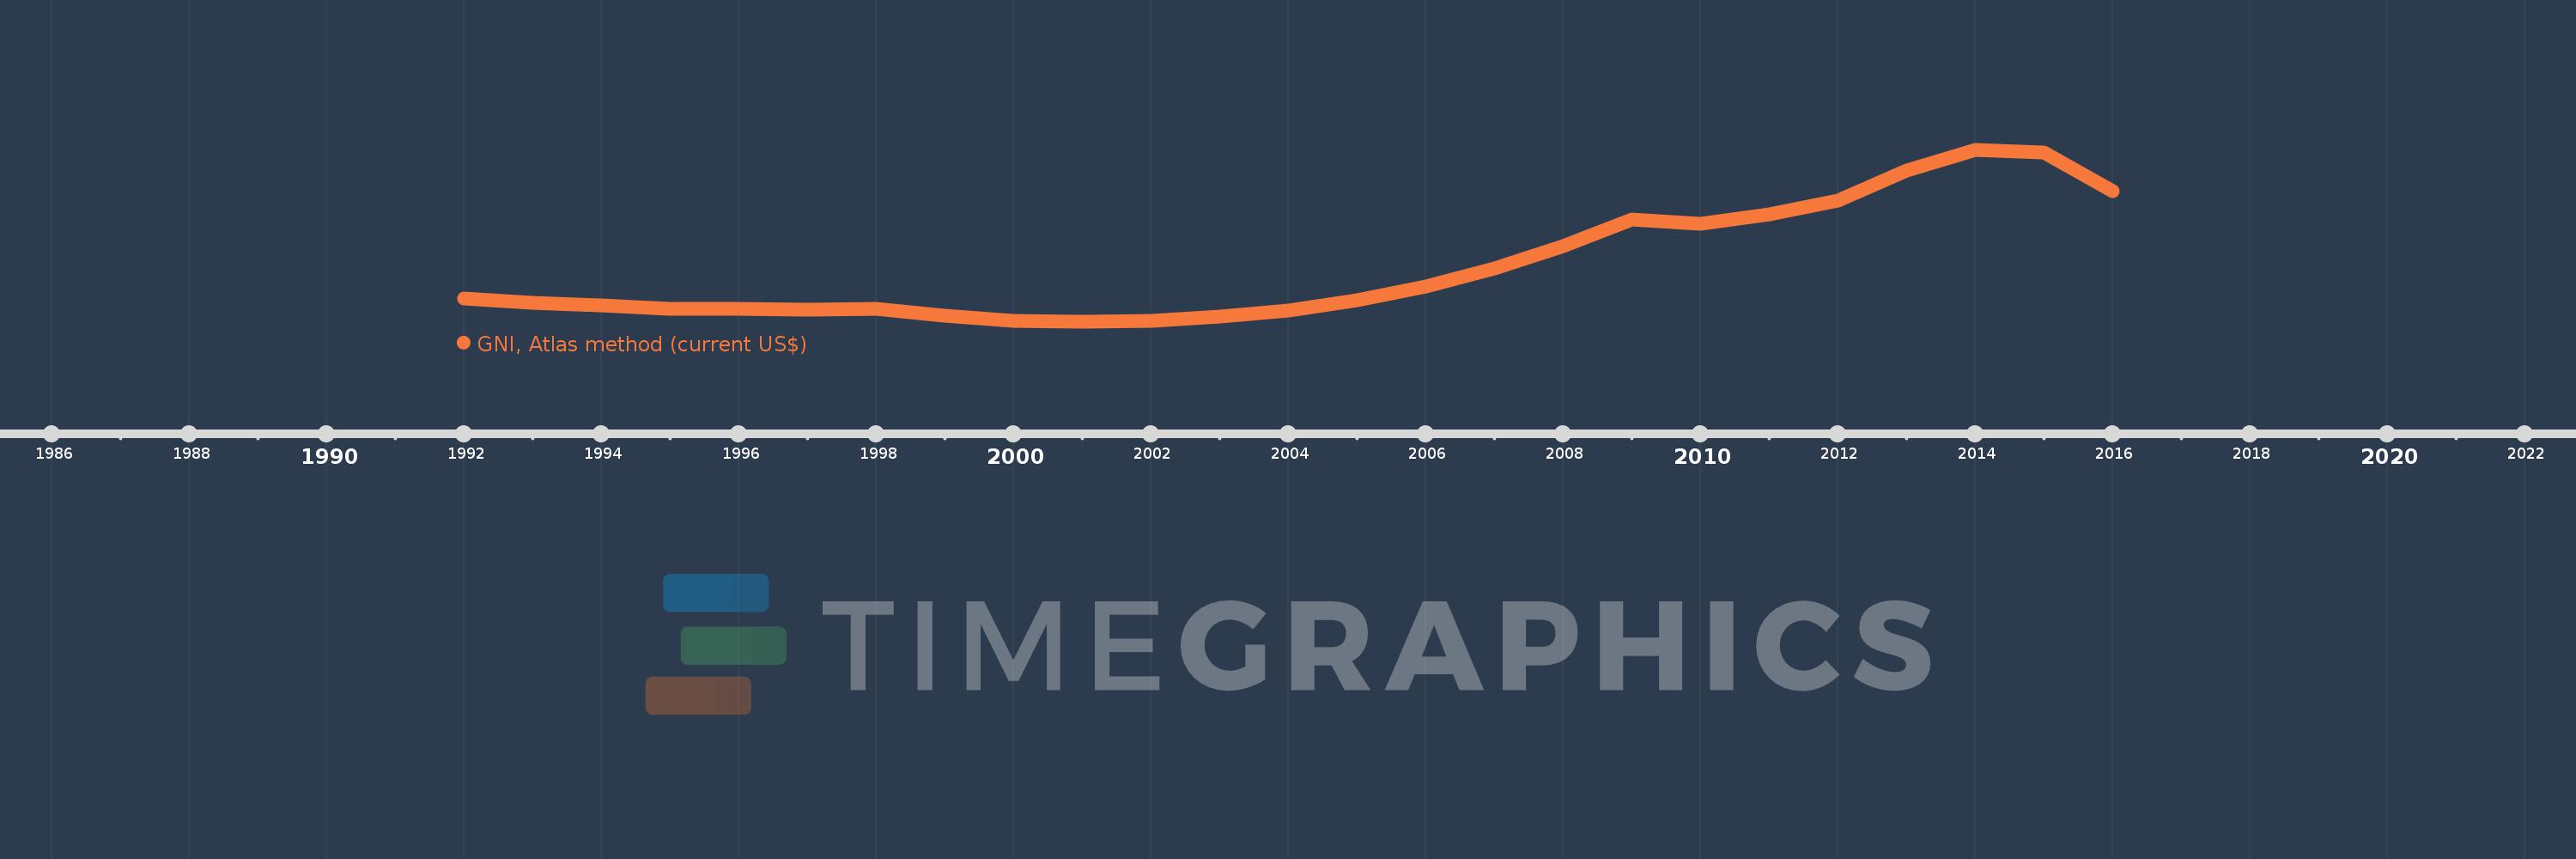
This timeline shows a graph from 1992 to 2016 of Russian Federation. No data until 1991. Number of actual observations by date: 25.
Source name:
World Development Indicators
Source organization:
World Bank national accounts data, and OECD National Accounts data files.
Categories, topics:
Economy & Growth
Last updated:
apr 23, 2017
Indicators value changes by year
Minimum:
250.286 bln
jan 1, 2001
Maximum:
2.126 trl
jan 1, 2014
At the date of observation
Value
Absolute change
Change from previous value
jan 1, 1992
510.75 bln
+510.75 bln
0.0%
jan 1, 1993
458.309 bln
-52.44 bln
-10.27%
jan 1, 1994
433.096 bln
-25.213 bln
-5.5%
jan 1, 1995
393.237 bln
-39.859 bln
-9.2%
jan 1, 1996
392.142 bln
-1.095 bln
-0.28%
jan 1, 1997
386.291 bln
-5.852 bln
-1.49%
jan 1, 1998
391.636 bln
+5.346 bln
1.38%
jan 1, 1999
314.754 bln
-76.883 bln
-19.63%
jan 1, 2000
258.144 bln
-56.61 bln
-17.99%
jan 1, 2001
250.286 bln
-7.858 bln
-3.04%
jan 1, 2002
259.618 bln
+9.332 bln
3.73%
jan 1, 2003
305.699 bln
+46.081 bln
17.75%
jan 1, 2004
373.91 bln
+68.211 bln
22.31%
jan 1, 2005
490.582 bln
+116.672 bln
31.2%
jan 1, 2006
638.474 bln
+147.892 bln
30.15%
jan 1, 2007
830.146 bln
+191.672 bln
30.02%
jan 1, 2008
1.08 trl
+249.846 bln
30.1%
jan 1, 2009
1.369 trl
+288.602 bln
26.72%
jan 1, 2010
1.318 trl
-50.099 bln
-3.66%
jan 1, 2011
1.425 trl
+106.628 bln
8.09%
jan 1, 2012
1.578 trl
+153.078 bln
10.74%
jan 1, 2013
1.906 trl
+327.305 bln
20.74%
jan 1, 2014
2.126 trl
+220.455 bln
11.57%
jan 1, 2015
2.097 trl
-29.449 bln
-1.39%
jan 1, 2016
1.676 trl
-420.528 bln
-20.06%
Ranking of countries by current statistics by years


Comments: